Essay
Quarterly sales of a department store for the last seven years are given in the following table. 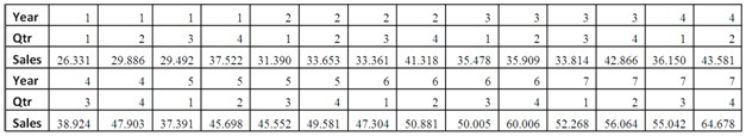
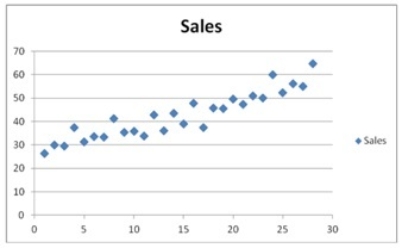 The Excel scatterplot shown indicates that the quarterly sales have an increasing trend and seasonality.Therefore,the linear regression model,Sales = β0 + β1Qtr1 + β2Qtr2 + β3Qtr3 + β4t + ε,with three seasonal dummy variables Qtr1,Qtr2,and Qtr3,and the decomposition method are proposed to make sales forecasts.For the regression model,the following Excel partial output is available.
  (Use Excel or statistical software. )Using the decomposition method:
a.Compute the adjusted seasonal indices for the four quarters.
b.Find the linear trend equation for the seasonally adjusted quarterly sales.
c.Make the sales forecasts for the first and fourth quarter of Year 8.
Correct Answer:

Verified
For a given time series yt,the seasonally...View Answer
Unlock this answer now
Get Access to more Verified Answers free of charge
Correct Answer:
Verified
View Answer
Unlock this answer now
Get Access to more Verified Answers free of charge
Q18: Ideally, the chosen model is best in
Q51: Quarterly sales of a department store for
Q52: The following table shows the annual revenues
Q53: The exponential smoothing method weighs all available
Q54: Quarterly sales of a department store for
Q55: The following table includes the information about
Q61: Based on quarterly data collected over the
Q65: Which of the following models is not
Q75: After we have estimated the trend and
Q95: A seasonal component differs from a cyclical