Essay
The following table shows the annual revenues (in millions of dollars)of a pharmaceutical company over the period 1990-2011. 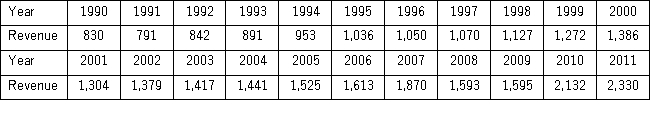 The autoregressive models of order 1 and 2,yt = β0 + β1yt - 1 + εt,and yt = β0 + β1yt - 1 + β2yt - 2+ εt,were applied on the time series to make revenue forecasts.The relevant parts of Excel regression outputs are given below.
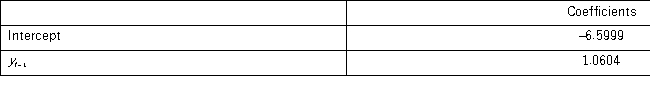
Model AR(1): 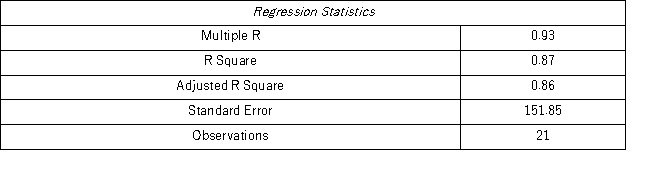
 Model AR(2):
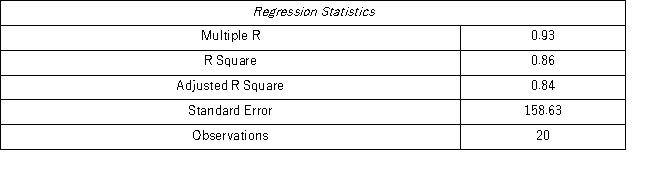
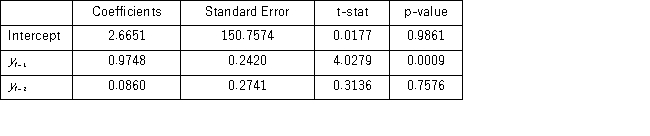 Using the AR(2)model,find the company revenue forecast for 2012.
Correct Answer:

Verified
The AR(1)model is specified as yt = β0 + β...View Answer
Unlock this answer now
Get Access to more Verified Answers free of charge
Correct Answer:
Verified
View Answer
Unlock this answer now
Get Access to more Verified Answers free of charge
Q3: Which of the following is not a
Q4: In the decomposition method,which of the following
Q8: The following table shows the annual revenues
Q9: Which of the following formulas is used
Q11: The following table shows the annual revenues
Q48: If the regression framework is used to
Q59: A polynomial trend model that only allows
Q79: The exponential trend model is attractive when
Q83: The _ method is a smoothing technique
Q107: The centered moving average (CMA), applied in