Essay
A sociologist studies the relationship between a district's average score on a standardized test for 10th-grade students (y),the average school expenditures per student (x1 in $1,000s),and an index of the socioeconomic status of the district (x2).The following model is estimated:  .A portion of the regression results is shown in the accompanying table.
 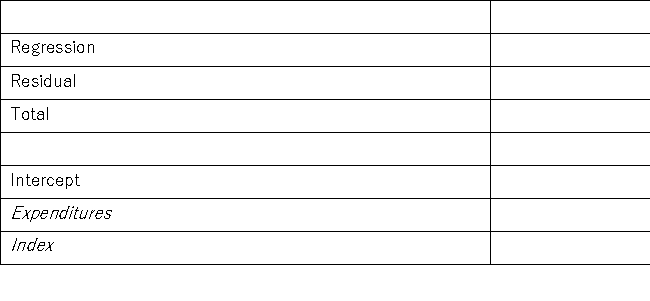 a.Predict a district's average test score if average expenditures are $4,500 and the district's social index is 8.
b.Interpret the slope coefficient attached to Expenditures.
c.Calculate the standard error of the estimate.
d.Calculate and interpret the coefficient of determination.
e.Calculate the adjusted R2.
Correct Answer:

Verified
The regression equation is  .Use given c...
View Answer
Unlock this answer now
Get Access to more Verified Answers free of charge
Correct Answer:
Verified
View Answer
Unlock this answer now
Get Access to more Verified Answers free of charge
Q6: In the estimation of a multiple regression
Q7: A sociologist examines the relationship between the
Q8: An real estate analyst believes that the
Q10: An marketing analyst wants to examine the
Q12: Consider the following data: <img src="https://d2lvgg3v3hfg70.cloudfront.net/TB4266/.jpg" alt="Consider
Q13: Costco sells paperback books in their retail
Q14: A portfolio manager is interested in reducing
Q15: Consider the sample regression equation <img src="https://d2lvgg3v3hfg70.cloudfront.net/TB4266/.jpg"
Q16: When estimating <img src="https://d2lvgg3v3hfg70.cloudfront.net/TB4266/.jpg" alt="When estimating
Q62: _ correlation can make two variables appear