Multiple Choice
Automobiles traveling on a road with a posted speed limit of 65 miles per hour are checked for speed by a state police radar system.The following table is a frequency distribution of speeds. 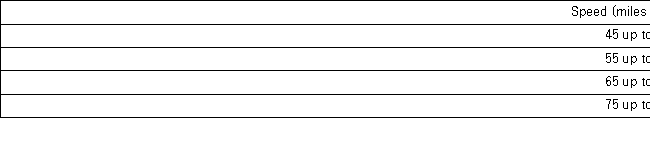 What proportion of the cars traveled at least 55 but less than 65 miles per hour?
A) 0.33
B) 0.48
C) 0.56
D) 0.80
Correct Answer:

Verified
Correct Answer:
Verified
Q23: What graphical tool is best used to
Q60: When constructing a frequency distribution for quantitative
Q78: A stem-and-leaf diagram most resembles a(n) _.<br>
Q99: In the accompanying stem-and-leaf diagram,the values in
Q100: Construct a stem-and-leaf diagram with the following
Q101: The organization of the Girl Sprouts has
Q102: Use the following data to construct a
Q107: The statistics professor has kept attendance records
Q108: The following frequency distribution shows the frequency
Q109: Thirty students at Eastside High School took