Multiple Choice
The following frequency distribution shows the frequency of the asking price,in thousands of dollars,for current homes on the market in a particular city. 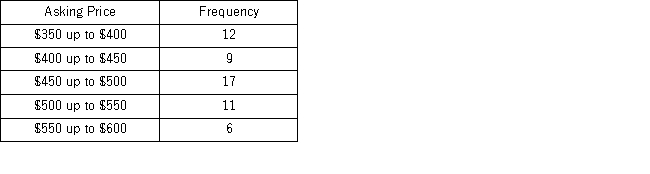 What percentage of houses has an asking price between $350,000 and under $400,000?
A) 16.4%
B) 21.8%
C) 30.9%
D) 33.3%
Correct Answer:

Verified
Correct Answer:
Verified
Q23: What graphical tool is best used to
Q60: When constructing a frequency distribution for quantitative
Q78: A stem-and-leaf diagram most resembles a(n) _.<br>
Q86: When constructing a pie chart, only a
Q104: Automobiles traveling on a road with a
Q107: The statistics professor has kept attendance records
Q109: Thirty students at Eastside High School took
Q110: T <img src="https://d2lvgg3v3hfg70.cloudfront.net/TB4266/.jpg" alt="T Using
Q111: Consider the following stem-and-leaf diagram. <img src="https://d2lvgg3v3hfg70.cloudfront.net/TB4266/.jpg"
Q113: In the accompanying stem-and-leaf diagram,the values in