Multiple Choice
The statistics professor has kept attendance records and recorded the number of absent students per class.The recorded data is displayed in the following histogram with the frequency of each number of absent students shown above the bars. 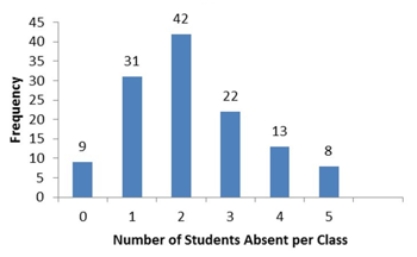 How many statistics classes had three or more students absent?
A) 8
B) 13
C) 22
D) 43
Correct Answer:

Verified
Correct Answer:
Verified
Q23: What graphical tool is best used to
Q60: When constructing a frequency distribution for quantitative
Q78: A stem-and-leaf diagram most resembles a(n) _.<br>
Q86: When constructing a pie chart, only a
Q102: Use the following data to construct a
Q104: Automobiles traveling on a road with a
Q108: The following frequency distribution shows the frequency
Q109: Thirty students at Eastside High School took
Q110: T <img src="https://d2lvgg3v3hfg70.cloudfront.net/TB4266/.jpg" alt="T Using
Q111: Consider the following stem-and-leaf diagram. <img src="https://d2lvgg3v3hfg70.cloudfront.net/TB4266/.jpg"