Multiple Choice
The following stem-and-leaf diagram shows the last 20 dividend payments (in cents) paid by Proctor and Gamble. 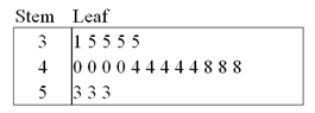 The most common dividend payment is _____.
A) 0.35
B) 0.40
C) 0.44
D) 0.48
Correct Answer:

Verified
Correct Answer:
Verified
Related Questions
Q2: An analyst constructed the following frequency distribution
Q3: Johnson and Johnson (JNJ)is a consumer staples
Q4: The following frequency distribution shows the frequency
Q5: The following histogram represents the number of
Q6: The accompanying cumulative relative frequency distribution shows
Q9: What type of relationship is indicated in
Q10: Automobiles traveling on a road with a
Q11: The following table lists some of the
Q12: The following is a list of five
Q18: For both qualitative and quantitative data, what