Essay
The following table lists some of the busiest ports in the world based on the number of containers in 2010. 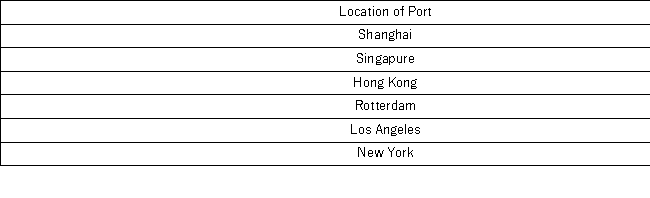 Construct a pie chart to summarize the data.Approximately what percent of the total number of containers go through Hong Kong?
Correct Answer:

Verified
To construct a pie chart in Excel,select...View Answer
Unlock this answer now
Get Access to more Verified Answers free of charge
Correct Answer:
Verified
View Answer
Unlock this answer now
Get Access to more Verified Answers free of charge
Q6: The accompanying cumulative relative frequency distribution shows
Q7: The following stem-and-leaf diagram shows the last
Q9: What type of relationship is indicated in
Q10: Automobiles traveling on a road with a
Q12: The following is a list of five
Q15: A car dealership created a scatterplot showing
Q16: A survey conducted by CBS news asked
Q18: For both qualitative and quantitative data, what
Q75: A stem-and-leaf diagram is useful in that
Q108: For qualitative data, a frequency distribution groups