Essay
A high school football league recorded the average points scored per game,as well as the winning percentage,for the 10 teams in the league. 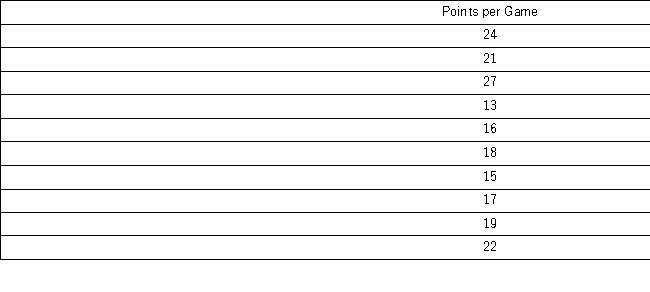 Construct a scatterplot.Does scoring more points appear to be associated with a higher winning percentage?
Correct Answer:

Verified
To construct the scatterplot,plot each t...View Answer
Unlock this answer now
Get Access to more Verified Answers free of charge
Correct Answer:
Verified
View Answer
Unlock this answer now
Get Access to more Verified Answers free of charge
Q42: A bar chart may be displayed horizontally.
Q50: Graphically, we can show a(n) _ _
Q62: For quantitative data, a relative frequency distribution
Q93: In the following pie chart representing a
Q96: A city in California spent $6 million
Q97: When constructing a frequency distribution for quantitative
Q99: In the accompanying stem-and-leaf diagram,the values in
Q100: Construct a stem-and-leaf diagram with the following
Q101: The organization of the Girl Sprouts has
Q102: Use the following data to construct a