Multiple Choice
A city in California spent $6 million repairing damage to its public buildings in 2010.The following table shows the categories where the money was directed. 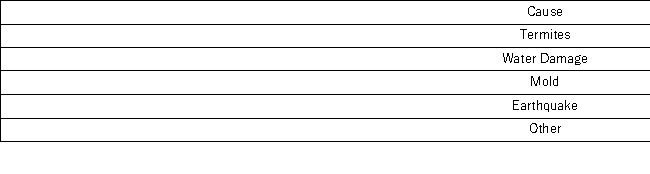 How much did the city spend to fix damage caused by mold?
A) $360,000
B) $720,000
C) $1,440,000
D) $1,800,000
Correct Answer:

Verified
Correct Answer:
Verified
Q42: A bar chart may be displayed horizontally.
Q50: Graphically, we can show a(n) _ _
Q62: For quantitative data, a relative frequency distribution
Q91: Students in Professor Smith's business statistics course
Q93: In the following pie chart representing a
Q97: When constructing a frequency distribution for quantitative
Q97: A high school football league recorded the
Q99: In the accompanying stem-and-leaf diagram,the values in
Q100: Construct a stem-and-leaf diagram with the following
Q101: The organization of the Girl Sprouts has