Multiple Choice
In the following pie chart representing a collection of cookbooks,which author has more titles? 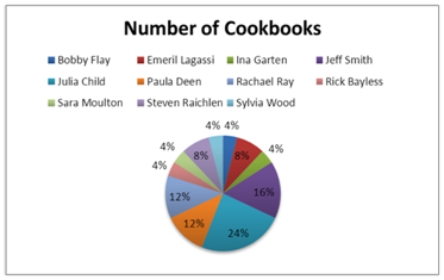
A) Jeff Smith
B) Julia Child
C) Rachael Ray
D) Paula Deen
Correct Answer:

Verified
Correct Answer:
Verified
Q42: A bar chart may be displayed horizontally.
Q50: Graphically, we can show a(n) _ _
Q59: What may be revealed from a scatterplot?<br>A)
Q62: For quantitative data, a relative frequency distribution
Q88: The following table shows analyst sentiment ratings
Q90: Consider the following frequency distribution. <img src="https://d2lvgg3v3hfg70.cloudfront.net/TB4266/.jpg"
Q91: Students in Professor Smith's business statistics course
Q96: A city in California spent $6 million
Q97: When constructing a frequency distribution for quantitative
Q97: A high school football league recorded the