Multiple Choice
Figure 12.1: MP Curve 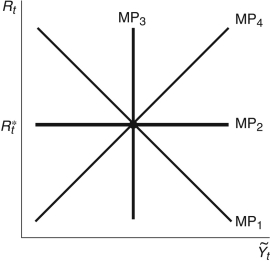
-In Figure 12.1, if the Federal Reserve sets the real interest rate at  , which line represents the MP curve?
A) 
B) 
C) 
D) 
E) Not enough information is given.
Correct Answer:

Verified
Correct Answer:
Verified
Related Questions
Q110: Figure 12.20: Change in Inflation (
Q111: Figure 12.6: IS-MP Curve <img src="https://d2lvgg3v3hfg70.cloudfront.net/TB6622/.jpg" alt="Figure
Q112: The money demand curve slopes upward with
Q113: Recent energy legislation that dictates increased use
Q114: Figure 12.13 shows the yield curve for
Q116: If we replace the actual rate of
Q117: Refer to the following figure when answering
Q118: If prices are sticky and there are
Q119: In March and April 1980, inflation in
Q120: Refer to the following figure when answering