Essay
Figure 12.20: Change in Inflation ( ): 1977-1982 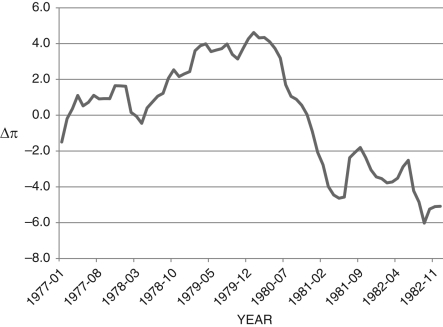
-Consider Figure 12.20, which shows the change in inflation from 1977-1982. If you are the Fed chairman during this period, G. William Miller (1978-1979) and Paul Volcker (1979-1987), what is your primary concern during the periods of, roughly, 1978-1980 and 1982? What would you do to remedy this situation? What curve are you likely to consider when you make your policy decision?
Correct Answer:

Verified
The Phillips curve shows that there is a...View Answer
Unlock this answer now
Get Access to more Verified Answers free of charge
Correct Answer:
Verified
View Answer
Unlock this answer now
Get Access to more Verified Answers free of charge
Q105: In the Phillips curve <img src="https://d2lvgg3v3hfg70.cloudfront.net/TB6622/.jpg" alt="In
Q106: Discuss the differences between the ex ante
Q107: Refer to the following figure when answering
Q108: The Phillips curve assumes inflation expectations are
Q109: Refer to the following figure when answering
Q111: Figure 12.6: IS-MP Curve <img src="https://d2lvgg3v3hfg70.cloudfront.net/TB6622/.jpg" alt="Figure
Q112: The money demand curve slopes upward with
Q113: Recent energy legislation that dictates increased use
Q114: Figure 12.13 shows the yield curve for
Q115: Figure 12.1: MP Curve <img src="https://d2lvgg3v3hfg70.cloudfront.net/TB6622/.jpg" alt="Figure