Multiple Choice
Figure 12.6: IS-MP Curve 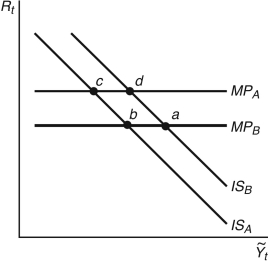
-Start from any equilibrium in Figure 12.6 to answer the following question. In 1980, U.S. inflation hit about 14 percent; Federal Reserve chairman ________ engineered a decline in inflation by ________ rates, shown in the figure as movement from point ________.
A) Volcker; raising inflation; b to c
B) Bernanke; raising interest; b to d
C) Volcker; lowering interest; c to b
D) Volcker; raising interest; b to c
E) Greenspan; lowering interest; a to b
Correct Answer:

Verified
Correct Answer:
Verified
Q106: Discuss the differences between the ex ante
Q107: Refer to the following figure when answering
Q108: The Phillips curve assumes inflation expectations are
Q109: Refer to the following figure when answering
Q110: Figure 12.20: Change in Inflation (
Q112: The money demand curve slopes upward with
Q113: Recent energy legislation that dictates increased use
Q114: Figure 12.13 shows the yield curve for
Q115: Figure 12.1: MP Curve <img src="https://d2lvgg3v3hfg70.cloudfront.net/TB6622/.jpg" alt="Figure
Q116: If we replace the actual rate of