Multiple Choice
The following table shows real GDP and potential real GDP for the years 2005-2015. Refer to this table when answering the following questions.
Table 10.1 ($ billions) 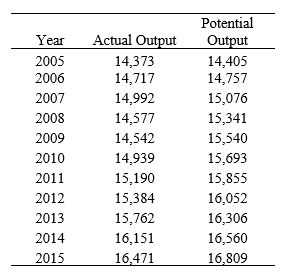 (Source: Federal Reserve Economic Data, St. Louis Federal Reserve)
-During which year was the economy in an expansionary gap?
A) 2001
B) 2004
C) 2002
D) 2003
E) none of the above
Correct Answer:

Verified
Correct Answer:
Verified
Q27: The average decline in GDP growth for
Q28: IMF studies conducted after the financial crisis
Q29: Briefly compare the impact of the Great
Q30: The following figure shows the daily three-month
Q31: In addition to oil price increases in
Q33: The majority of mortgage-backed securities were held
Q34: Figure 10.2 shows the U.S. housing price
Q35: The Federal Deposit Insurance Corporation was established,
Q36: In 1933, the _ was established to
Q37: When was the deepest recession since the