Multiple Choice
The following figure shows the daily three-month treasury yield in September 2008. Refer to the following figure when answering the following questions.
Figure 10.1: Daily Three-Month Treasury Yield: September 2008 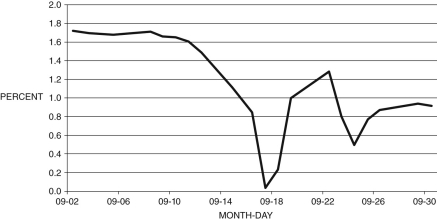
-Consider the data in Figure 10.1. What does the data for mid-September in this figure suggest?
A) Increasing investor confidence in the effectiveness of TARP led to smaller purchases of U.S. treasuries.
B) There was a rapid movement of assets from treasuries to stocks.
C) In the aftermath of the collapse of Lehman Brothers, investors fled to the safety of short-term treasuries.
D) Prices of gold declined in line with short-term treasury yields.
E) General Motors and Chrysler declared bankruptcy.
Correct Answer:

Verified
Correct Answer:
Verified
Q25: Unemployment in the Great Recession peaked at
Q26: One of the key differences between the
Q27: The average decline in GDP growth for
Q28: IMF studies conducted after the financial crisis
Q29: Briefly compare the impact of the Great
Q31: In addition to oil price increases in
Q32: The following table shows real GDP and
Q33: The majority of mortgage-backed securities were held
Q34: Figure 10.2 shows the U.S. housing price
Q35: The Federal Deposit Insurance Corporation was established,