Essay
Figure 10.2 shows the U.S. housing price index (solid line, left axis) and one-year adjustable mortgage rates (dashed line, right axis). In the context of the housing and financial crisis, discuss the relationship between these two series.Figure 10.2: Housing Prices and One -Year Adjustable Mortgage Rates 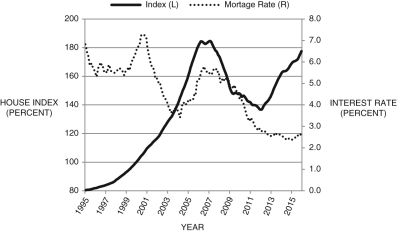
(Source: Federal Reserve Economic II, St. Louis Federal Reserve)
Correct Answer:

Verified
The answer will depend on the student; h...View Answer
Unlock this answer now
Get Access to more Verified Answers free of charge
Correct Answer:
Verified
View Answer
Unlock this answer now
Get Access to more Verified Answers free of charge
Q29: Briefly compare the impact of the Great
Q30: The following figure shows the daily three-month
Q31: In addition to oil price increases in
Q32: The following table shows real GDP and
Q33: The majority of mortgage-backed securities were held
Q35: The Federal Deposit Insurance Corporation was established,
Q36: In 1933, the _ was established to
Q37: When was the deepest recession since the
Q38: When all depositors converge on a bank
Q39: Bank leverage is equal to a bank's