Multiple Choice
Refer to the following figure when answering the following questions.
Figure 9.5: U.S. Inflation 1960-2015 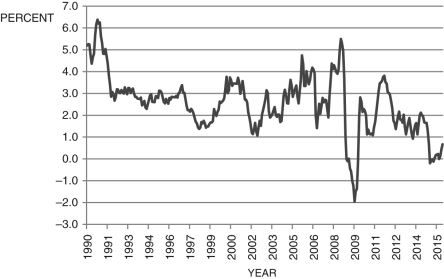 (Source: Bureau of Labor Statistics)
-Consider Figure 9.5, which shows the annual inflation rate. According to the Phillips curve, the period from about 1998 to 2000 was a period of:
A) stagnation.
B) a slumping economy.
C) a booming economy.
D) None of these answers is correct.
E) Not enough information is given.
Correct Answer:

Verified
Correct Answer:
Verified
Q103: Refer to the following figure when answering
Q104: Refer to the following figure to answer
Q105: If <img src="https://d2lvgg3v3hfg70.cloudfront.net/TB6622/.jpg" alt="If
Q106: Which is responsible for dating business cycles?<br>A)
Q107: Which is responsible for dating business cycles?<br>A)
Q108: According to Okun's law, if the Federal
Q109: Refer to the following figure when answering
Q111: If <img src="https://d2lvgg3v3hfg70.cloudfront.net/TB6622/.jpg" alt="If ,
Q112: Figure 9.8: Cyclical Unemployment: 1980-2015 <img src="https://d2lvgg3v3hfg70.cloudfront.net/TB6622/.jpg"
Q113: Refer to the following figure when answering