Multiple Choice
Refer to the following figure when answering the following questions.
Figure 9.2: U.S. Output Fluctuations 1960-2015 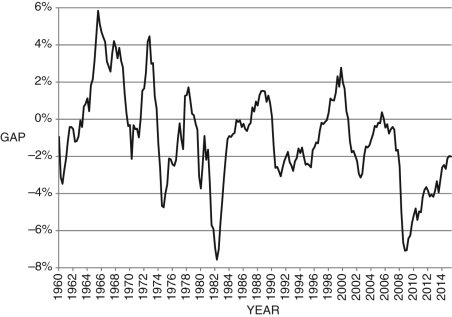
-Consider Figure 9.2. In approximately which of the following years was current output equal to potential output?
A) 1966, 1974, 1979, 2000, and 2004
B) 1961, 1975, 1983, 2002, and 2009
C) 1963, 1970, 1974, 1985, 1998, 2001, and 2005
D) 1961, 1975, 1979, 2000, and 2008
E) 1966, 1974, 1983, 2002, and 2010
Correct Answer:

Verified
Correct Answer:
Verified
Q103: Refer to the following figure when answering
Q104: Refer to the following figure to answer
Q105: If <img src="https://d2lvgg3v3hfg70.cloudfront.net/TB6622/.jpg" alt="If
Q106: Which is responsible for dating business cycles?<br>A)
Q107: Which is responsible for dating business cycles?<br>A)
Q108: According to Okun's law, if the Federal
Q109: Refer to the following figure when answering
Q110: Refer to the following figure when answering
Q111: If <img src="https://d2lvgg3v3hfg70.cloudfront.net/TB6622/.jpg" alt="If ,
Q112: Figure 9.8: Cyclical Unemployment: 1980-2015 <img src="https://d2lvgg3v3hfg70.cloudfront.net/TB6622/.jpg"