Essay
Figure 9.8: Cyclical Unemployment: 1980-2015 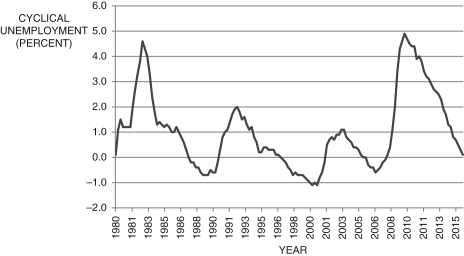 (Source: Federal Reserve Economic Data, St. Louis Federal Reserve)
-The figure above shows cyclical unemployment for the years 1980-2015. Using your best guess by looking at the figure, what was the output gap in 1992, 2003, 2010, and 2015? What is the change in inflation for those years?
Correct Answer:

Verified
To answer the first part of the question...View Answer
Unlock this answer now
Get Access to more Verified Answers free of charge
Correct Answer:
Verified
View Answer
Unlock this answer now
Get Access to more Verified Answers free of charge
Q103: Refer to the following figure when answering
Q104: Refer to the following figure to answer
Q105: If <img src="https://d2lvgg3v3hfg70.cloudfront.net/TB6622/.jpg" alt="If
Q106: Which is responsible for dating business cycles?<br>A)
Q107: Which is responsible for dating business cycles?<br>A)
Q108: According to Okun's law, if the Federal
Q109: Refer to the following figure when answering
Q110: Refer to the following figure when answering
Q111: If <img src="https://d2lvgg3v3hfg70.cloudfront.net/TB6622/.jpg" alt="If ,
Q113: Refer to the following figure when answering