Multiple Choice
Francis Galton, a contemporary of Charles Darwin, studied variation in complex traits such as human height. Use the bar graphs shown below to answer the following question: Which of the following statements best describes Figure 18.7 graph (b) , which depicts Galton's data showing distribution of offspring height from the shortest parents he studied? 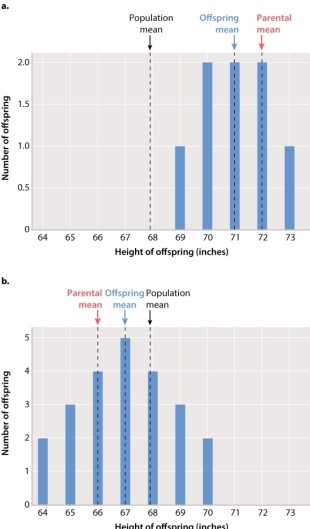
A) The parental mean for the shortest parents is larger than the mean height of their offspring.
B) The parental mean for the shortest parents is smaller than the mean height of their offspring.
C) Offspring from the shortest parents are taller than most members of the population.
D) The average height of the shortest parents is greater than the mean height of the population.
E) None of the answer options is correct.
Correct Answer:

Verified
Correct Answer:
Verified
Q135: Which of the traits in the
Q136: According to the graph from Figure 18.10,
Q137: When heritability is 100%, the variation among
Q138: If genetically different strains of corn are
Q139: Most human variation is due to _
Q141: Examine the graph below, which shows the
Q142: A concordance of 50% for a trait
Q143: Identical twins are:<br>A)identical in genotype.<br>B)identical in phenotype.<br>C)always
Q144: In a study of concordance, a sample
Q145: Red coloration in wheat seeds is a