Multiple Choice
Examine the graph below, which shows the distribution of the magnitude of gene effects for the different genes contributing to a complex trait. Which of the following statements accurately describes what the graph shows? 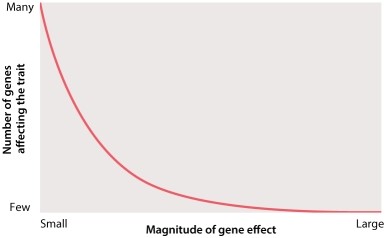
A) Most often, a single gene with a small effect has a large effect on a complex trait.
B) Most genes that affect a complex trait have relatively large effects.
C) Most often, multiple genes with large effects are the sole contributors to complex traits.
D) It is easier to identify genes for a complex trait if you examine many genes with a lower magnitude of effect.
E) Most genes that affect a complex trait have relatively small effects.
Correct Answer:

Verified
Correct Answer:
Verified
Q136: According to the graph from Figure 18.10,
Q137: When heritability is 100%, the variation among
Q138: If genetically different strains of corn are
Q139: Most human variation is due to _
Q140: Francis Galton, a contemporary of Charles Darwin,
Q142: A concordance of 50% for a trait
Q143: Identical twins are:<br>A)identical in genotype.<br>B)identical in phenotype.<br>C)always
Q144: In a study of concordance, a sample
Q145: Red coloration in wheat seeds is a
Q146: Which of the traits in the