Multiple Choice
According to the graph from Figure 18.10, shown below, which complex trait shows very little influence from a genetic component? 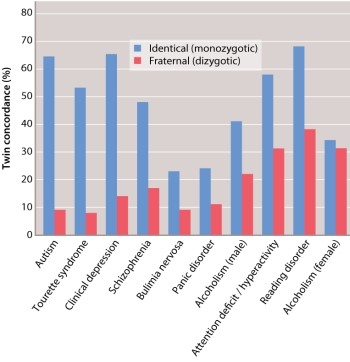
A) autism
B) clinical depression
C) schizophrenia
D) male alcoholism
E) female alcoholism
Correct Answer:

Verified
Correct Answer:
Verified
Related Questions
Q131: The data in the table below
Q132: Traits that are influenced by multiple genes
Q133: Which of the following birth anomalies are
Q134: Traits such as human height, blood pressure,
Q135: Which of the traits in the
Q137: When heritability is 100%, the variation among
Q138: If genetically different strains of corn are
Q139: Most human variation is due to _
Q140: Francis Galton, a contemporary of Charles Darwin,
Q141: Examine the graph below, which shows the