Multiple Choice
Refer to the following graph.The price of capital r) is $20. 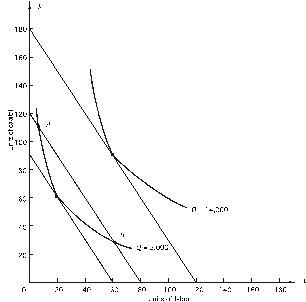 What combination of K and L should the firm choose to produce 14,000 units of output at the lowest cost?
A) 180K,120L
B) 180K,0L
C) 60K,120L
D) 90K,60L
E) none of the above
Correct Answer:

Verified
Correct Answer:
Verified
Q45: The marginal rate of technical substitution is<br>A)the
Q57: Diseconomies of scale<br>A)exist when fixed cost increases
Q57: Refer to the following graph.The price of
Q58: In the graph below,the price of capital
Q59: In the graph below,the price of capital
Q61: Refer to the following graph.The price of
Q63: Refer to the following figure.The price of
Q65: <img src="https://d2lvgg3v3hfg70.cloudfront.net/TB2562/.jpg" alt=" In the above
Q66: Refer to the following figure.The price of
Q67: Refer to the following graph.The price of