Multiple Choice
Refer to the following graph.The price of labor is $3 per unit: 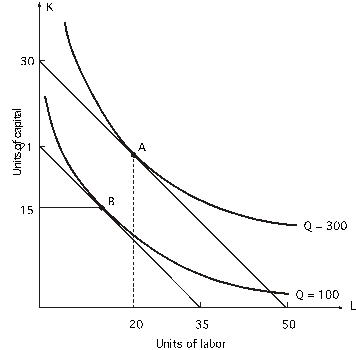 What is the marginal rate of technical substitution at point B?
A) 0.6
B) 0.75
C) 1
D) 1.7
Correct Answer:

Verified
Correct Answer:
Verified
Related Questions
Q45: The marginal rate of technical substitution is<br>A)the
Q62: Refer to the following graph.The price of
Q63: Refer to the following figure.The price of
Q65: <img src="https://d2lvgg3v3hfg70.cloudfront.net/TB2562/.jpg" alt=" In the above
Q66: Refer to the following figure.The price of
Q68: In the graph below,the price of capital
Q69: Refer to the following graph.The price of
Q71: Following is a firm's expansion path.The price
Q72: Following is a firm's expansion path.The price
Q89: Economies of scale exist when<br>A)total cost decreases