Multiple Choice
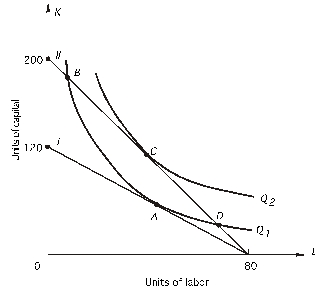 In the above graph,the shift from I to II was due to
A) an increase in total cost.
B) an increase in the price of labor.
C) a decrease in the price of labor.
D) an increase in the price of capital.
E) a decrease in the price of capital.
Correct Answer:

Verified
Correct Answer:
Verified
Q45: The marginal rate of technical substitution is<br>A)the
Q57: Diseconomies of scale<br>A)exist when fixed cost increases
Q61: Refer to the following graph.The price of
Q62: Refer to the following graph.The price of
Q63: Refer to the following figure.The price of
Q66: Refer to the following figure.The price of
Q67: Refer to the following graph.The price of
Q68: In the graph below,the price of capital
Q69: Refer to the following graph.The price of
Q89: Economies of scale exist when<br>A)total cost decreases