Multiple Choice
In the graph below,the price of capital is $500 per unit.Given a total cost of $50,000,the maximum amount of output possible is 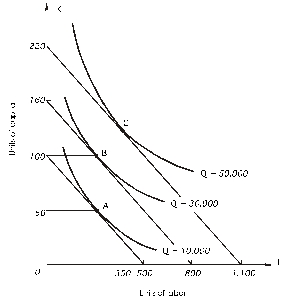
A) 500 units of output.
B) 1,100 units of output.
C) 10,000 units of output.
D) 50,000 units of output.
E) none of the above
Correct Answer:

Verified
Correct Answer:
Verified
Q45: The marginal rate of technical substitution is<br>A)the
Q63: Refer to the following figure.The price of
Q65: <img src="https://d2lvgg3v3hfg70.cloudfront.net/TB2562/.jpg" alt=" In the above
Q66: Refer to the following figure.The price of
Q67: Refer to the following graph.The price of
Q68: The slope of an isoquant is<br>A)-∆K/∆L.<br>B)MP<sub>L</sub> /
Q69: Refer to the following graph.The price of
Q71: Following is a firm's expansion path.The price
Q72: Following is a firm's expansion path.The price
Q89: Economies of scale exist when<br>A)total cost decreases