Multiple Choice
Figure 5.1
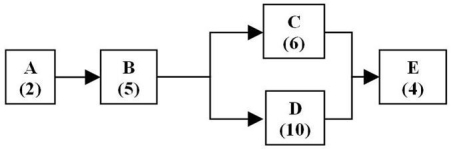
The figure above shows the process for paying tuition at a major university. Students receive their bill, for the next term, for review. They are directed to different tables for clarifications, before being asked to pay their tuition at E. The numbers in parentheses are the time in minutes for each step of the process.
-Use the information in Figure 5.1. If 60% of the students are routed to C and 40% are routed to D, what is the average capacity per hour for the process?
A) 10 students per hour
B) 6.5 student per hour
C) 8 students per hour
D) 8.4 students per hour
Correct Answer:

Verified
Correct Answer:
Verified
Q85: A(n) _ is an operation that has
Q86: Balance the assembly line for the tasks
Q87: The Theory of Constraints method is also
Q88: Line balancing strives to create workstations so
Q89: Table 5.3<br>King Supply makes four different types
Q91: Consider the following production process. It is
Q92: A line balance that is 100% efficient
Q93: Table 5.3<br>King Supply makes four different types
Q94: Figure 5.4<br> <img src="https://d2lvgg3v3hfg70.cloudfront.net/TB1252/.jpg" alt="Figure 5.4
Q95: The traditional method of determining contribution margin