Essay
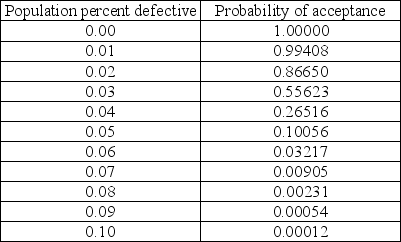
In the table below are selected values for the OC curve for the acceptance sampling plan n = 210,c = 6.Upon failed inspection,defective items are replaced.Calculate the AOQ for each data point.(You may assume that the population is much larger than the sample. )Plot the AOQ curve.At approximately what population defective rate is the AOQ at its worst? Explain how this happens.How well does this plan meet the specifications of AQL = 0.015,α = 0.05;LTPD = 0.05,β = 0.10? Discuss.
Correct Answer:

Verified
The plan meets the α...View Answer
Unlock this answer now
Get Access to more Verified Answers free of charge
Correct Answer:
Verified
View Answer
Unlock this answer now
Get Access to more Verified Answers free of charge
Q9: The type of inspection that classifies items
Q27: The process capability measures Cp and Cpk
Q30: A consultant has been brought in to
Q54: Can "in control" and "capable" be shown
Q98: When a lot has been accepted by
Q113: A manager wants to build 3-sigma control
Q116: Which of the following is true regarding
Q129: A normal distribution is generally described by
Q146: If the Cpk index exceeds 1<br>A) the
Q256: A p-chart is appropriate to plot the