Exam 4: Regression Models
Exam 1: Introduction to Quantitative Analysis71 Questions
Exam 2: Probability Concepts and Applications157 Questions
Exam 3: Decision Analysis128 Questions
Exam 4: Regression Models133 Questions
Exam 5: Forecasting111 Questions
Exam 6: Inventory Control Models123 Questions
Exam 7: Linear Programming Models: Graphical and Computer Methods110 Questions
Exam 8: Linear Programming Applications105 Questions
Exam 9: Transportation,assignment,and Network Models98 Questions
Exam 10: Integer Programming,goal Programming,and Nonlinear Programming98 Questions
Exam 11: Project Management134 Questions
Exam 12: Waiting Lines and Queuing Theory Models145 Questions
Exam 13: Simulation Modeling79 Questions
Exam 14: Markov Analysis86 Questions
Exam 15: Statistical Quality Control98 Questions
Exam 16: Analytic Hierarchy Process53 Questions
Exam 17: Dynamic Programming67 Questions
Exam 18: Decision Theory and the Normal Distribution50 Questions
Exam 19: Game Theory47 Questions
Exam 20: Mathematical Tools: Determinants and Matrices99 Questions
Exam 21: Calculus-Based Optimization24 Questions
Exam 22: Linear Programming: The Simplex Method100 Questions
Exam 23: Transportation, Assignment, and Network Algorithms111 Questions
Select questions type
The correlation coefficient resulting from a particular regression analysis was 0.25.What was the coefficient of determination?
(Multiple Choice)
4.7/5  (35)
(35)
If multicollinearity exists,then individual interpretation of the variables is questionable,but the overall model is still good for prediction purposes.
(True/False)
4.8/5 (28)
Consider the regression model Y = 389.10 - 14.6X.If the r2 value is 0.657,what is the correlation coefficient?
(Essay)
4.9/5 (34)
Which of the following statements provides the best guidance for model building?
(Multiple Choice)
5.0/5 (32)
The multiple regression model includes several dependent variables.
(True/False)
4.9/5 (28)
A reference to the criterion used to select the regression line,to minimize the squared distances between the estimated straight line and the observed values is called
(Multiple Choice)
4.8/5 (38)
In a scatter diagram,the dependent variable is typically plotted on the horizontal axis.
(True/False)
4.8/5 (31)
The multiple regression model includes several intercept terms.
(True/False)
4.9/5 (40)
Summing the error values in a regression model is misleading because negative errors cancel out positive errors.
(True/False)
4.8/5 (41)
The SSR indicates how much of the total variability in the dependent variable is explained by the regression model.
(True/False)
5.0/5 (31)
A large international sales organization has collected data on the number of employees and the annual gross sales during the last 7 years. 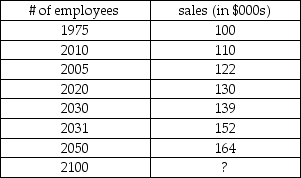 (a)Develop a scatter diagram.
(b)Determine the correlation coefficient.
(c)Determine the coefficient of determination.
(d)Determine the least squares trend line.
(e)Determine the predicted value of sales for 2100 employees.
(a)Develop a scatter diagram.
(b)Determine the correlation coefficient.
(c)Determine the coefficient of determination.
(d)Determine the least squares trend line.
(e)Determine the predicted value of sales for 2100 employees.
(Essay)
4.9/5 (35)
Filters
- Essay(0)
- Multiple Choice(0)
- Short Answer(0)
- True False(0)
- Matching(0)