Exam 15: Statistical Quality Control
Exam 1: Introduction to Quantitative Analysis71 Questions
Exam 2: Probability Concepts and Applications157 Questions
Exam 3: Decision Analysis128 Questions
Exam 4: Regression Models133 Questions
Exam 5: Forecasting111 Questions
Exam 6: Inventory Control Models123 Questions
Exam 7: Linear Programming Models: Graphical and Computer Methods110 Questions
Exam 8: Linear Programming Applications105 Questions
Exam 9: Transportation,assignment,and Network Models98 Questions
Exam 10: Integer Programming,goal Programming,and Nonlinear Programming98 Questions
Exam 11: Project Management134 Questions
Exam 12: Waiting Lines and Queuing Theory Models145 Questions
Exam 13: Simulation Modeling79 Questions
Exam 14: Markov Analysis86 Questions
Exam 15: Statistical Quality Control98 Questions
Exam 16: Analytic Hierarchy Process53 Questions
Exam 17: Dynamic Programming67 Questions
Exam 18: Decision Theory and the Normal Distribution50 Questions
Exam 19: Game Theory47 Questions
Exam 20: Mathematical Tools: Determinants and Matrices99 Questions
Exam 21: Calculus-Based Optimization24 Questions
Exam 22: Linear Programming: The Simplex Method100 Questions
Exam 23: Transportation, Assignment, and Network Algorithms111 Questions
Select questions type
For the problems which follow,match the following.
-Column 1:  -chart
Column 2: Average of variables
-chart
Column 2: Average of variables
Free
(Essay)
5.0/5  (32)
(32)
Correct Answer: Verified
Average of variables
A(n)________ chart is appropriate to monitor the percent of mortalities due to heart problems.
Free
(Essay)
4.7/5 (37)
Correct Answer:Verified
p-
Table 15-1 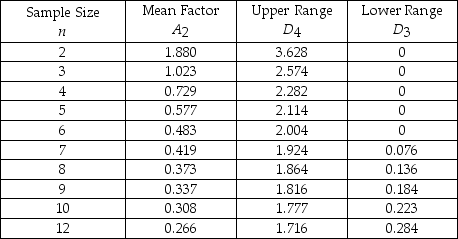 -Refer to Table 15-1.The Pristine Paint Company produces paint in gallon cans.They have found that in more than 10 samples of 8 cans each,the average gallon can contains 1.1 gallons of paint.The average range found over these samples is 0.15 gallons.What is the upper control limit for the sample averages in this process?
Free
(Multiple Choice)
4.7/5 (27)
Correct Answer:Verified
D
Match the following.
-Column 1: D3
 Column 2: Lower control limit for a range chart
(Essay)
4.9/5 (33)
A p-chart has been developed for a particular item.In the past,4% of such items have been found to be defective.If a sample of 100 is taken,and 9 of these are found to be defective,should the process be considered out of control based on 99.7% control limits? Explain.
(Essay)
4.9/5 (35)
Technically,to achieve Six Sigma quality,there would have to be fewer than 3.4 defects per million opportunities.
(True/False)
4.9/5 (34)
Technically,to achieve Six Sigma quality,there would have to be fewer than ________ defects per million opportunities.
(Multiple Choice)
4.8/5 (40)
Defects in the finish of new,custom,automobiles usually require the whole body to be repainted.In one "custom" shop,the percentage of defective finishes has been 2 percent.If a sample size of 10 is taken,what should the 99.7 percent upper control limit be?
(Multiple Choice)
4.9/5 (32)
Table 15-1
-Refer to Table 15-1.To guarantee that cans of soup are properly filled,some cans are sampled and the amounts measured.The overall average for the samples is 12 ounces.Each sample contains 10 cans.The average range is 0.4 ounces.The upper control chart limit for the sample averages would be
(Multiple Choice)
4.9/5 (26)
Match the following.
-Column 1:  ± A2
± A2
 Column 2: Control limits for an
  chart
chart
(Essay)
4.8/5 (34)
An x-bar chart would be appropriate to monitor the number of defects in a production lot.
(True/False)
4.9/5 (36)
Table 15-2
Given the sample results (100 units in each sample): 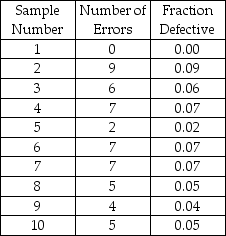 -The c-chart is useful when we
(Multiple Choice)
4.8/5 (31)
A quality control program is being developed for batteries.The percent defective for these in the past has been 3%.If a sample size of 120 is taken,what would the 99.7% upper control chart limit be?
(Multiple Choice)
4.8/5 (38)
A coffee company is attempting to make certain that all its packaged coffee beans contain the same amount of coffee bean by weight.Over the last few days,it has taken several samples.The overall average weight of the sampled packages is 16 ounces,with an average range of 3 ounces.Each sample was of four packages.What would be the 99.7 upper and lower control limits for an R chart?
(Essay)
4.9/5 (40)
Samples sizes of five are often used when building control charts.
(True/False)
4.9/5 (37)
Table 15-2
Given the sample results (100 units in each sample):
-A company has been receiving complaints about the attitude of some sales clerks.Over a 10-day period,the total number of complaints was 360.The company wishes to develop a control chart for the number of complaints.What would the upper control limit on the number of complaints per day be for a 2 sigma (95.5%)control chart?
(Multiple Choice)
4.8/5 (30)
Defects in marble countertops usually require the whole top to be reconstructed.In one kitchen shop,the percent defective in the past has been one percent.If a sample size of 30 is taken,what should the 95.5 percent upper control limit be?
(Multiple Choice)
4.9/5 (36)
Defects in computer hard-drives will usually render the entire computer worthless.For a particular model,the percent defective in the past has been 1%.If a sample size of 400 is taken,what would the 95.5% lower control chart limit be?
(Multiple Choice)
4.7/5 (41)
Filters
- Essay(0)
- Multiple Choice(0)
- Short Answer(0)
- True False(0)
- Matching(0)