Exam 5: Hypothesis Testing and Statistical Inference
Exam 1: Data and Business Decisions93 Questions
Exam 2: Descriptive Statistics and Data Analysis99 Questions
Exam 3: Probability Concepts and Distributions111 Questions
Exam 4: Sampling and Estimation123 Questions
Exam 5: Hypothesis Testing and Statistical Inference99 Questions
Exam 6: Regression Analysis93 Questions
Exam 7: Forecasting100 Questions
Exam 8: Introduction to Statistical Quality Control101 Questions
Exam 9: Building and Using Decision Models74 Questions
Exam 10: Decision Models With Uncertainty and Risk90 Questions
Exam 11: Decisions, uncertainty, and Risk100 Questions
Exam 12: Queues and Process Simulation Modeling97 Questions
Exam 13: Linear Optimization98 Questions
Exam 14: Integer, nonlinear, and Advanced Optimization Methods100 Questions
Select questions type
The probability of a Type I error can be specified by the investigator.The probability of a Type II error is ________.
(Multiple Choice)
4.9/5  (23)
(23)
When conducting two-sample tests for means with independent samples,________.
(Multiple Choice)
4.9/5 (37)
In the test statistic for a one-sample test for proportion,π0 is the ________.
(Multiple Choice)
4.8/5 (34)
Use the below information to answer the following question(s).
A company wishes to test whether the proportion of female managers is the same as the proportion of male managers.The following table provides data for a sample of employees. ![Use the below information to answer the following question(s). A company wishes to test whether the proportion of female managers is the same as the proportion of male managers.The following table provides data for a sample of employees. -Which of the following is the test statistic? [Hint: Use PHStat]](https://storage.examlex.com/TB2972/11eabc4c_bb20_d9ec_8797_05c73cb32ce9_TB2972_00_TB2972_00.jpg) -Which of the following is the test statistic? [Hint: Use PHStat]
-Which of the following is the test statistic? [Hint: Use PHStat]
(Multiple Choice)
4.8/5 (38)
In two‐sample test for means with paired samples,the test statistic is given by ________.
(Multiple Choice)
4.8/5 (39)
In testing the difference between two population parameters,if the confidence interval for the difference contains 0,then the corresponding null hypothesis will not be rejected.
(True/False)
4.8/5 (33)
Read the following scenario and select the correct answer. There is a large range of starting salaries among software engineers.Sample statistics have been collected to determine if patterns emerge that can help explain this variability.It was found that the mean starting income for men is $42,000 and the mean starting income for women is $52,000.What conclusions can you make from this information?
(Multiple Choice)
4.8/5 (37)
Compute the 95% confidence interval for the mean difference.What is the conclusion?
(Essay)
4.7/5 (37)
Use the below information to answer the following question(s).
The following table shows the number of customers that each of the four counters of a retail store have billed in the past few days. 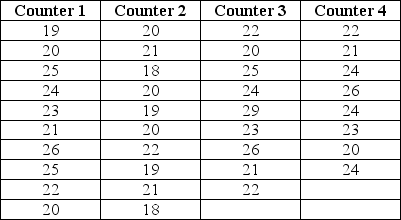 -ANOVA concluded that at least one mean is different from others.However,it did not determine which of the means is significantly different from the rest.Now,to apply the Tukey-Kramer multiple comparison procedure to determine these significant differences,first identify the Q Statistic.
(Short Answer)
4.7/5 (35)
The test statistic for a one-sample test for proportions is ________.
(Multiple Choice)
4.7/5 (40)
In hypothesis testing,the null and the alternative hypotheses are ________.
(Multiple Choice)
4.9/5 (33)
An online retailer wanted to see if purchasing patterns were different between male consumers and female consumers.Males were found to have spent a mean of $85 per month on online purchases,whereas females were found to have spent a mean of $78 per month.An independent samples t-test was conducted to assess the observed difference between the two groups of consumers.A two-tailed test was applied.The value of the t-Test Statistic for the observed differences was -4.7,where the p-value is less than 0.0002.What conclusion can be made about the observed difference?
(Multiple Choice)
4.7/5 (34)
Use the below information to answer the following question(s).
The following table provides data on a sample of customers who visited a local restaurant.The restaurant owner believes that the average profit per customer exceeds $25. 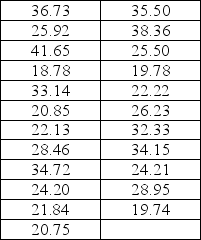 -Which of the following is the critical value using a level of significance of 0.05?
(Multiple Choice)
4.9/5 (29)
To determine if there was a statistically significant difference in the means of two independent groups,which statistical tool would one be most likely to employ to assess the significance of any observed difference?
(Multiple Choice)
4.8/5 (27)
Differentiate between one- and two-tailed tests of hypothesis.How is the rejection region determined for a one-tailed test?
(Essay)
4.9/5 (33)
Filters
- Essay(0)
- Multiple Choice(0)
- Short Answer(0)
- True False(0)
- Matching(0)