Exam 5: Hypothesis Testing and Statistical Inference
Exam 1: Data and Business Decisions93 Questions
Exam 2: Descriptive Statistics and Data Analysis99 Questions
Exam 3: Probability Concepts and Distributions111 Questions
Exam 4: Sampling and Estimation123 Questions
Exam 5: Hypothesis Testing and Statistical Inference99 Questions
Exam 6: Regression Analysis93 Questions
Exam 7: Forecasting100 Questions
Exam 8: Introduction to Statistical Quality Control101 Questions
Exam 9: Building and Using Decision Models74 Questions
Exam 10: Decision Models With Uncertainty and Risk90 Questions
Exam 11: Decisions, uncertainty, and Risk100 Questions
Exam 12: Queues and Process Simulation Modeling97 Questions
Exam 13: Linear Optimization98 Questions
Exam 14: Integer, nonlinear, and Advanced Optimization Methods100 Questions
Select questions type
PHStat has a tool for conducting the two-sample hypothesis tests for proportions.The test is called ________.
(Multiple Choice)
4.8/5  (35)
(35)
In one-sample tests for means,if the population standard deviation is unknown,then the sampling distribution of the mean is normal.
(True/False)
4.9/5 (33)
What test statistic is evaluated when testing for equality of variances?
(Multiple Choice)
4.9/5 (33)
When the assumptions underlying ANOVA are violated,________ is used.
(Multiple Choice)
4.8/5 (32)
The decision to reject or fail to reject a null hypothesis is based on computing a ________ from sample data.
(Multiple Choice)
4.8/5 (29)
The chi‐square test statistic for a one-sample test for the variance is ________.
(Multiple Choice)
4.8/5 (30)
Use the below information to answer the following question(s).
The table below shows the sample data for color preferences by gender. 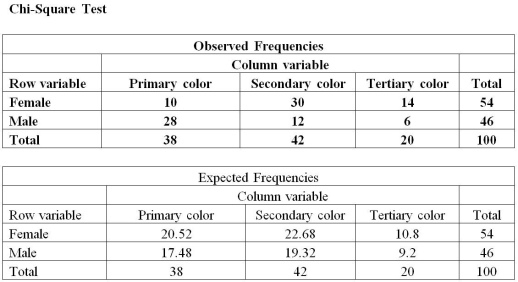
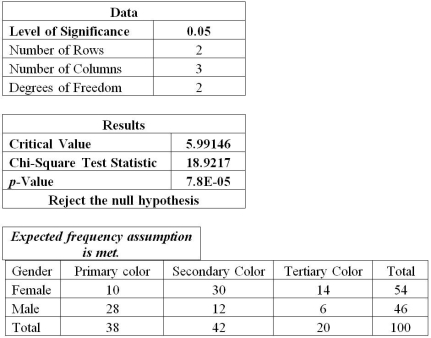 -Formulate the hypotheses to whether the proportion of females who prefer a particular category of color is no different from the proportion of males.
(Essay)
4.9/5 (21)
The area that overlaps the hypothesized distribution in the acceptance region is α,the probability of a Type I error.
(True/False)
4.8/5 (33)
Use the below information to answer the following question(s).
The following table provides data on a sample of customers who visited a local restaurant.The restaurant owner believes that the average profit per customer exceeds $25.  -Which of the following is the conclusion?
(Multiple Choice)
5.0/5 (26)
Use the below information to answer the following question(s).
The following table provides data on a sample of customers who visited a local restaurant.The restaurant owner believes that the average profit per customer exceeds $25.
-Which of the following is the test statistic?
(Multiple Choice)
4.7/5 (40)
A one-tailed test is employed when the null hypothesis ________.
(Multiple Choice)
4.9/5 (37)
Filters
- Essay(0)
- Multiple Choice(0)
- Short Answer(0)
- True False(0)
- Matching(0)