Exam 4: Describing Data: Displaying and Exploring Data
Exam 1: What Is Statistics79 Questions
Exam 2: Describing Data: Frequency Distributions and Graphic Presentations81 Questions
Exam 3: Describing Data: Numerical Measures115 Questions
Exam 4: Describing Data: Displaying and Exploring Data85 Questions
Exam 5: A Survey of Probability Concepts106 Questions
Exam 6: Discrete Probability Distributions94 Questions
Exam 7: Continuous Probability Distributions90 Questions
Exam 8: Sampling Methods and the Central Limit Theorem92 Questions
Exam 9: Estimation and Confidence Intervals94 Questions
Exam 10: One-Sample Tests of Hypothesis140 Questions
Exam 11: Two-Sample Tests of Hypothesis77 Questions
Exam 12: Analysis of Variance94 Questions
Exam 13: Linear Regression and Correlation135 Questions
Exam 14: Multiple Regression and Correlation Analysis125 Questions
Exam 15: Chi-Square Applications101 Questions
Select questions type
For a distribution,the 2nd quartile,the 5th decile,and the 50th percentile,are the same as the median.
Free
(True/False)
4.8/5  (35)
(35)
Correct Answer: Verified
True
What is the value of the Pearson coefficient of skewness for a distribution with a mean of 17,median of 12 and standard deviation of 6?
Free
(Multiple Choice)
4.9/5 (31)
Correct Answer:Verified
A
A scatter diagram is an easy way to represent the relationship between two variables.
Free
(True/False)
4.8/5 (35)
Correct Answer:Verified
True
A telemarketing firm is monitoring the performance of its employees based on the number of sales per hour.One employee had the following sales for the last 20 hours. 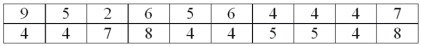 What is the first quartile for the distribution of number of sales per hour? ________________
(Short Answer)
4.8/5 (40)
If Pearson's coefficient of skewness is equal to 0,then the mean and median are equal.
(True/False)
4.9/5 (30)
An outlier is a value in a data set that is inconsistent with the rest of the data.
(True/False)
4.9/5 (34)
A relationship between two nominal variables is summarized by a contingency table.
(True/False)
4.7/5 (38)
A telemarketing firm is monitoring the performance of its employees based on the number of sales per hour.One employee had the following sales for the last 20 hours. 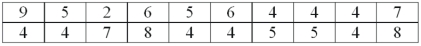 What is the third quartile for the distribution of number of sales per hour? _____________
(Short Answer)
4.8/5 (36)
In a box plot,if a value is more than 1.5 times the interquartile range from the first or third quartile,the value is an outlier.
(True/False)
4.8/5 (36)
Given the sample information in the following table regarding public opinion on gun control,who is more likely to favor gun control? 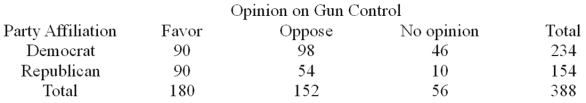
(Essay)
4.8/5 (33)
What is the common purpose of a scatter diagram and a contingency table?
(Essay)
4.7/5 (33)
A study of the net sales of a sample of small corporations revealed that the mean net sales is $2.1 million,the median $2.4 million,the modal sales $2.6 million and the standard deviation of the distribution is $500,000.What is the Pearson's coefficient of skewness?
(Multiple Choice)
4.8/5 (37)
If the mean of a distribution is smaller than the median and mode,what is the sign of Pearson's coefficient of skewness? _______________
(Short Answer)
4.9/5 (40)
If Pearson's coefficient of skewness is negative,then the distribution is skewed to the left.
(True/False)
4.9/5 (36)
A telemarketing firm is monitoring the performance of its employees based on the number of sales per hour.One employee had the following sales for the last 20 hours. 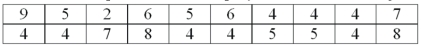 What is the median for the distribution of number of sales per hour? ____________
(Short Answer)
4.7/5 (29)
Quartiles are another way to describe the central location of a distribution.
(True/False)
4.8/5 (31)
Filters
- Essay(0)
- Multiple Choice(0)
- Short Answer(0)
- True False(0)
- Matching(0)