Exam 10: Two-Sample Tests
Exam 1: Instruction and Data Collection47 Questions
Exam 2: Presenting Data in Tables and Charts277 Questions
Exam 3: Numerical Descriptive Measures139 Questions
Exam 4: Basic Probability137 Questions
Exam 5: Some Important Discrete Probability Distributions188 Questions
Exam 6: The Normal Distribution and Other Continuous Distributions164 Questions
Exam 7: Sampling and Sampling Distributions187 Questions
Exam 8: Confidence Interval Estimation173 Questions
Exam 9: Fundamentals of Hypothesis Testing: One-Sample Tests146 Questions
Exam 10: Two-Sample Tests190 Questions
Exam 11: Analysis of Variance127 Questions
Exam 12: Chi-Square Tests and Nonparametric Tests174 Questions
Exam 13: Simple Linear Regression198 Questions
Exam 14: Introduction to Multiple Regression215 Questions
Exam 15: Multiple Regression Model Building101 Questions
Exam 16: Time-Series Analysis and Index Numbers133 Questions
Exam 17: Statistical Applications in Quality Management132 Questions
Exam 18: Data Analysis Overview52 Questions
Select questions type
TABLE 10-11
A corporation randomly selects 150 salespeople and finds that 66% who have never taken a self-improvement course would like such a course. The firm did a similar study 10 years ago in which 60% of a random sample of 160 salespeople wanted a self-improvement course. The groups are assumed to be independent random samples. Let π1 and π2 represent the true proportion of workers who would like to attend a self-improvement course in the recent study and the past study, respectively.
-Referring to Table 10-11, what is the estimated standard error of the difference between the two sample proportions?
Free
(Multiple Choice)
4.7/5  (33)
(33)
Correct Answer: Verified
C
If we are testing for the difference between the means of 2 independent populations presumes equal variances with samples of n1 = 20 and n2 = 20, the number of degrees of freedom is equal to
Free
(Multiple Choice)
4.8/5 (32)
Correct Answer:Verified
B
A Marine drill instructor recorded the time in which each of 11 recruits completed an obstacle course both before and after basic training. To test whether any improvement occurred, the instructor would use a t-distribution with 10 degrees of freedom.
Free
(True/False)
4.8/5 (38)
Correct Answer:Verified
True
TABLE 10-13
A quality control engineer is in charge of the manufacture of computer disks. Two different processes can be used to manufacture the disks. He suspects that the Kohler method produces a greater proportion of defects than the Russell method. He samples 150 of the Kohler and 200 of the Russell disks and finds that 27 and 18 of them, respectively, are defective. If Kohler is designated as "Group 1" and Russell is designated as "Group 2," perform the appropriate test at a level of significance of 0.01.
-Referring to Table 10-13, the hypotheses that should be tested are:
(Multiple Choice)
4.9/5 (35)
In testing for the differences between the means of two related populations, we assume that the differences follow a ________ distribution.
(Short Answer)
4.9/5 (46)
The Wall Street Journal recently ran an article indicating differences in perception of sexual harassment on the job between men and women. The article claimed that women perceived the problem to be much more prevalent than did men. One question asked to both men and women was: "Do you think sexual harassment is a major problem in the American workplace?" Some 24% of the men compared to 62% of the women responded "Yes." Suppose that 150 women and 200 men were interviewed. For a 0.01 level of significance, what is the critical value for the rejection region?
(Multiple Choice)
4.8/5 (33)
TABLE 10-7
To investigate the efficacy of a diet, a random sample of 16 male patients is drawn from a population of adult males using the diet. The weight of each individual in the sample is taken at the start of the diet and at a medical follow-up 4 weeks later. Assuming that the population of differences in weight before versus after the diet follow a normal distribution, the t-test for related samples can be used to determine if there was a significant decrease in the mean weight during this period. Suppose the mean decrease in weights over all 16 subjects in the study is 3.0 pounds with the standard deviation of differences computed as 6.0 pounds.
-Referring to Table 10-7, the p-value for a one-tail test is greater than ________ but less than ________.
(Short Answer)
4.9/5 (29)
TABLE 10-6
Two samples each of size 25 are taken from independent populations assumed to be normally distributed with equal variances. The first sample has a mean of 35.5 and standard deviation of 3.0 while the second sample has a mean of 33.0 and standard deviation of 4.0.
-Referring to Table 10-6, what is the 99% confidence interval estimate for the difference in the two means?
(Short Answer)
4.9/5 (38)
TABLE 10-6
Two samples each of size 25 are taken from independent populations assumed to be normally distributed with equal variances. The first sample has a mean of 35.5 and standard deviation of 3.0 while the second sample has a mean of 33.0 and standard deviation of 4.0.
-Referring to Table 10-6, the critical values for a two-tail test of the null hypothesis of no difference in the population means at the α = 0.05 level of significance are ________.
(Short Answer)
4.8/5 (35)
The sample size in each independent sample must be the same if we are to test for differences between the means of 2 independent populations.
(True/False)
4.8/5 (29)
TABLE 10-11
A corporation randomly selects 150 salespeople and finds that 66% who have never taken a self-improvement course would like such a course. The firm did a similar study 10 years ago in which 60% of a random sample of 160 salespeople wanted a self-improvement course. The groups are assumed to be independent random samples. Let π1 and π2 represent the true proportion of workers who would like to attend a self-improvement course in the recent study and the past study, respectively.
-Referring to Table 10-11, construct a 99% confidence interval estimate of the difference in proportion of workers who would like to attend a self-improvement course in the recent study and the past study.
(Short Answer)
4.9/5 (35)
TABLE 10-14
The amount of time required to reach a customer service representative has a huge impact on customer satisfaction. Below is the Excel output from a study to see whether there is evidence of a difference in the mean amounts of time required to reach a customer service representative between two hotels. Assume that the population variances in the amount of time for the two hotels are not equal.
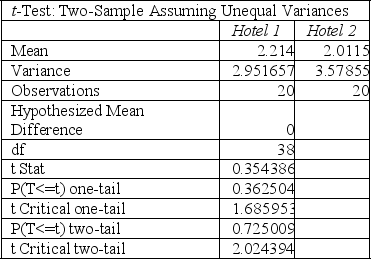 -Referring to Table 10-14, what is the 95% confidence interval estimate for the difference in the two means if the two population variances are assumed to be the same?
(Short Answer)
4.8/5 (34)
In testing for differences between the means of 2 related populations where the variance of the differences is unknown, the degrees of freedom are
(Multiple Choice)
4.7/5 (31)
TABLE 10-8
A buyer for a manufacturing plant suspects that his primary supplier of raw materials is overcharging. In order to determine if his suspicion is correct, he contacts a second supplier and asks for the prices on various identical materials. He wants to compare these prices with those of his primary supplier. The data collected is presented in the table below, with some summary statistics presented (all of these might not be necessary to answer the questions which follow). The buyer believes that the differences are normally distributed and will use this sample to perform an appropriate test at a level of significance of 0.01.
 -Referring to Table 10-8, the calculated value of the test statistic is ________.
(Short Answer)
4.8/5 (28)
TABLE 10-5
To test the effectiveness of a business school preparation course, 8 students took a general business test before and after the course. The results are given below.
 -Referring to Table 10-5, the number of degrees of freedom is
(Multiple Choice)
4.8/5 (41)
TABLE 10-11
A corporation randomly selects 150 salespeople and finds that 66% who have never taken a self-improvement course would like such a course. The firm did a similar study 10 years ago in which 60% of a random sample of 160 salespeople wanted a self-improvement course. The groups are assumed to be independent random samples. Let π1 and π2 represent the true proportion of workers who would like to attend a self-improvement course in the recent study and the past study, respectively.
-Referring to Table 10-11, construct a 95% confidence interval estimate of the difference in proportion of workers who would like to attend a self-improvement course in the recent study and the past study.
(Short Answer)
4.7/5 (35)
TABLE 10-13
A quality control engineer is in charge of the manufacture of computer disks. Two different processes can be used to manufacture the disks. He suspects that the Kohler method produces a greater proportion of defects than the Russell method. He samples 150 of the Kohler and 200 of the Russell disks and finds that 27 and 18 of them, respectively, are defective. If Kohler is designated as "Group 1" and Russell is designated as "Group 2," perform the appropriate test at a level of significance of 0.01.
-Referring to Table 10-13, the same decision would be made with this test if the level of significance had been 0.05 rather than 0.01.
(True/False)
4.8/5 (36)
TABLE 10-7
To investigate the efficacy of a diet, a random sample of 16 male patients is drawn from a population of adult males using the diet. The weight of each individual in the sample is taken at the start of the diet and at a medical follow-up 4 weeks later. Assuming that the population of differences in weight before versus after the diet follow a normal distribution, the t-test for related samples can be used to determine if there was a significant decrease in the mean weight during this period. Suppose the mean decrease in weights over all 16 subjects in the study is 3.0 pounds with the standard deviation of differences computed as 6.0 pounds.
-Referring to Table 10-7, the critical value for a one-tail test of the null hypothesis of no difference at the α = 0.05 level of significance is ________.
(Short Answer)
4.8/5 (33)
TABLE 10-12
The dean of a college is interested in the proportion of graduates from his college who have a job offer on graduation day. He is particularly interested in seeing if there is a difference in this proportion for accounting and economics majors. In a random sample of 100 of each type of major at graduation, he found that 65 accounting majors and 52 economics majors had job offers. If the accounting majors are designated as "Group 1" and the economics majors are designated as "Group 2," perform the appropriate hypothesis test using a level of significance of 0.05.
-Referring to Table 10-12, the value of the test statistic is ________.
(Short Answer)
4.8/5 (29)
When testing H0 : π1 - π2 ≥ 0 versus H1 : π1 - π2 < 0, the observed value of the Z-score was found to be -2.13. The p-value for this test would be
(Multiple Choice)
4.8/5 (41)
Filters
- Essay(0)
- Multiple Choice(0)
- Short Answer(0)
- True False(0)
- Matching(0)