Exam 17: Statistical Applications in Quality Management
Exam 1: Instruction and Data Collection47 Questions
Exam 2: Presenting Data in Tables and Charts277 Questions
Exam 3: Numerical Descriptive Measures139 Questions
Exam 4: Basic Probability137 Questions
Exam 5: Some Important Discrete Probability Distributions188 Questions
Exam 6: The Normal Distribution and Other Continuous Distributions164 Questions
Exam 7: Sampling and Sampling Distributions187 Questions
Exam 8: Confidence Interval Estimation173 Questions
Exam 9: Fundamentals of Hypothesis Testing: One-Sample Tests146 Questions
Exam 10: Two-Sample Tests190 Questions
Exam 11: Analysis of Variance127 Questions
Exam 12: Chi-Square Tests and Nonparametric Tests174 Questions
Exam 13: Simple Linear Regression198 Questions
Exam 14: Introduction to Multiple Regression215 Questions
Exam 15: Multiple Regression Model Building101 Questions
Exam 16: Time-Series Analysis and Index Numbers133 Questions
Exam 17: Statistical Applications in Quality Management132 Questions
Exam 18: Data Analysis Overview52 Questions
Select questions type
Which of the following is not part of the Shewhart-Deming cycle?
Free
(Multiple Choice)
4.9/5  (37)
(37)
Correct Answer: Verified
C
TABLE 17-7
A supplier of silicone sheets for producers of computer chips wants to evaluate her manufacturing process. She takes samples of size 5 from each day's output and counts the number of blemishes on each silicone sheet. The results from 20 days of such evaluations are presented below.
 She also decides that the upper specification limit is 10 blemishes.
-Referring to Table 17-7, an R chart is to be constructed for the number of blemishes. The upper control limit for this data set is ________.
She also decides that the upper specification limit is 10 blemishes.
-Referring to Table 17-7, an R chart is to be constructed for the number of blemishes. The upper control limit for this data set is ________.
Free
(Short Answer)
4.8/5 (37)
Correct Answer:Verified
11.52
CPL >1 implies that the process mean is more than 3 standard deviations away from the lower specification limit.
Free
(True/False)
4.7/5 (29)
Correct Answer:Verified
True
TABLE 17-4
A factory supervisor is concerned that the time it takes workers to complete an important production task (measured in seconds) is too erratic and adversely affects expected profits. The supervisor proceeds by randomly sampling 5 individuals per hour for a period of 10 hours. The sample mean and range for each hour are listed below.
 She also decides that lower and upper specification limit for the critical-to-quality variable should be 10 and 30 seconds, respectively.
-Referring to Table 17-4, suppose the sample mean and range data were based on 6 observations per hour instead of 5. How would this change affect the lower and upper control limits of an R chart?
She also decides that lower and upper specification limit for the critical-to-quality variable should be 10 and 30 seconds, respectively.
-Referring to Table 17-4, suppose the sample mean and range data were based on 6 observations per hour instead of 5. How would this change affect the lower and upper control limits of an R chart?
(Multiple Choice)
4.8/5 (28)
TABLE 17-3
A quality control analyst for a light bulb manufacturer is concerned that the time it takes to produce a batch of light bulbs is too erratic. Accordingly, the analyst randomly surveys 10 production periods each day for 14 days and records the sample mean and range for each day.
 -Referring to Table 17-3, suppose the analyst constructs an
  chart to see if the production process is in-control. What is the upper control limit (UCL) for this chart?
(Multiple Choice)
4.7/5 (39)
TABLE 17-6
The maker of a packaged candy wants to evaluate the quality of her production process. On each of 16 consecutive days, she samples 600 bags of candy and determines the number in each day's sample that she considers to be of poor quality. The data that she developed follow.
 -Referring to Table 17-6, construct a p control chart for these data.
(Essay)
4.7/5 (40)
Special or assignable causes of variation are signaled by individual fluctuations or patterns in the data.
(True/False)
4.9/5 (35)
TABLE 17-9
The manufacturer of cat food constructed control charts and analyzed several quality characteristics. One characteristic of interest is the weight of the filled cans. The lower specification limit for weight is 2.95 pounds. The table below provides the range and mean of the weights of five cans tested every fifteen minutes during a day's production.
 -Referring to Table 17-9, estimate the percentage of the cans whose weight is inside the specification limit.
(Short Answer)
4.8/5 (31)
Common causes of variation represent variation due to the inherent variability in the system.
(True/False)
4.8/5 (29)
In the United States, the control limits on a control chart are placed so that they are 3 standard deviations above and below a central line.
(True/False)
4.9/5 (36)
TABLE 17-4
A factory supervisor is concerned that the time it takes workers to complete an important production task (measured in seconds) is too erratic and adversely affects expected profits. The supervisor proceeds by randomly sampling 5 individuals per hour for a period of 10 hours. The sample mean and range for each hour are listed below.
She also decides that lower and upper specification limit for the critical-to-quality variable should be 10 and 30 seconds, respectively.
-Referring to Table 17-4, what is the value of the Cpk index?
(Short Answer)
4.9/5 (27)
TABLE 17-2
A political pollster randomly selects a sample of 100 voters each day for 8 successive days and asks how many will vote for the incumbent. The pollster wishes to construct a p chart to see if the percentage favoring the incumbent candidate is too erratic.
 -Referring to Table 17-2, what is the numerical value of the lower control limit for the p chart?
(Multiple Choice)
4.9/5 (31)
TABLE 17-7
A supplier of silicone sheets for producers of computer chips wants to evaluate her manufacturing process. She takes samples of size 5 from each day's output and counts the number of blemishes on each silicone sheet. The results from 20 days of such evaluations are presented below.
She also decides that the upper specification limit is 10 blemishes.
-Referring to Table 17-7, construct an R chart for the number of blemishes.
(Essay)
4.8/5 (40)
TABLE 17-8
Recently, a university switched to a new type of computer-based registration. The registrar is concerned with the amount of time students are spending on the computer registering under the new system. She decides to randomly select 8 students on each of the 12 days of the registration and determine the time each spends on the computer registering. The range, mean, and standard deviation of the times required to register are in the table that follows.
 -Referring to Table 17-8, based on the R chart, it appears that the process is out of control.
(True/False)
4.8/5 (31)
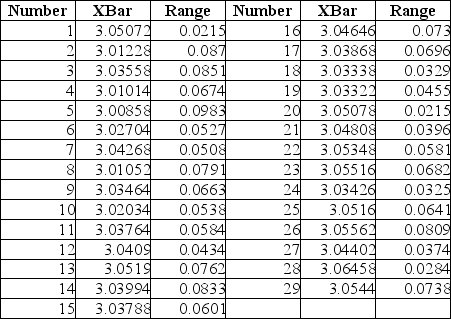
TABLE 17-9
The manufacturer of cat food constructed control charts and analyzed several quality characteristics. One characteristic of interest is the weight of the filled cans. The lower specification limit for weight is 2.95 pounds. The table below provides the range and mean of the weights of five cans tested every fifteen minutes during a day's production.
-Referring to Table 17-9, based on the  chart, it appears that the process is in control.
(True/False)
4.8/5 (45)
Determining the root causes of why defects can occur along with the variables in the process that cause these defects to occur involves which part of the DMAIC process?
(Multiple Choice)
4.9/5 (33)
TABLE 17-9
The manufacturer of cat food constructed control charts and analyzed several quality characteristics. One characteristic of interest is the weight of the filled cans. The lower specification limit for weight is 2.95 pounds. The table below provides the range and mean of the weights of five cans tested every fifteen minutes during a day's production.
-Referring to Table 17-9, an R chart is to be constructed for the weight. One way to create the lower control limit involves multiplying the average of the sample ranges by D3. For this data set, the value of D3 is ________.
(Short Answer)
4.9/5 (35)
Maintaining the gains that have been made with a revised process in the long term by avoiding potential problems that can occur when a process is changed involves which part of the DMAIC process?
(Multiple Choice)
4.9/5 (29)
Filters
- Essay(0)
- Multiple Choice(0)
- Short Answer(0)
- True False(0)
- Matching(0)