Exam 3: Numerical Descriptive Measures
Exam 1: Instruction and Data Collection47 Questions
Exam 2: Presenting Data in Tables and Charts277 Questions
Exam 3: Numerical Descriptive Measures139 Questions
Exam 4: Basic Probability137 Questions
Exam 5: Some Important Discrete Probability Distributions188 Questions
Exam 6: The Normal Distribution and Other Continuous Distributions164 Questions
Exam 7: Sampling and Sampling Distributions187 Questions
Exam 8: Confidence Interval Estimation173 Questions
Exam 9: Fundamentals of Hypothesis Testing: One-Sample Tests146 Questions
Exam 10: Two-Sample Tests190 Questions
Exam 11: Analysis of Variance127 Questions
Exam 12: Chi-Square Tests and Nonparametric Tests174 Questions
Exam 13: Simple Linear Regression198 Questions
Exam 14: Introduction to Multiple Regression215 Questions
Exam 15: Multiple Regression Model Building101 Questions
Exam 16: Time-Series Analysis and Index Numbers133 Questions
Exam 17: Statistical Applications in Quality Management132 Questions
Exam 18: Data Analysis Overview52 Questions
Select questions type
A boxplot is a graphical representation of a 5-number summary.
Free
(True/False)
4.8/5  (46)
(46)
Correct Answer: Verified
True
TABLE 3-7
In the 2009-2010 academic year, many public universities in the United States raised tuition and fees due to a decrease in state subsidies. The change in the cost of tuition, a shared dormitory room, and the most popular meal plan from the 2008-2009 academic year for a sample of 10 public universities were as follows: $1589, $593, $1223, $869, $423, $1720, $708, $1425, $922 and $308.
-Referring to Table 3-7, the middle 50% of the change in the cost is spread over what value?
Free
(Short Answer)
4.8/5 (35)
Correct Answer:Verified
$832
TABLE 3-2
The data below represent the amount of grams of carbohydrates in a serving of breakfast cereal in a sample of 11 different servings.
 -Referring to Table 3-2, the standard deviation of the carbohydrate amounts is ________ grams.
Free
(Short Answer)
4.8/5 (28)
Correct Answer:Verified
5.10
The rate of return for Microsoft's stock over a three year period is 0.527, 0.145, and 0.684. The geometric mean rate of return is ________.
(Short Answer)
4.8/5 (44)
TABLE 3-3
The ordered array below represents the number of vitamin supplements sold by a health food store in a sample of 16 days.
19, 19, 20, 20, 22, 23, 25, 26, 27, 30, 33, 34, 35, 36, 38, 41
Note: For this sample, the sum of the observations is 448, the sum of the squares of the observations is 13,356,
and the sum of the squared differences between each observation and the mean is 812.
-Referring to Table 3-3, the interquartile range of the number of vitamin supplements sold in this sample is ________.
(Short Answer)
4.8/5 (35)
TABLE 3-6
The rate of return of an Internet Service Provider over a 10 year period are: 10.25%, 12.64%, 8.37%, 9.29%, 6.23%, 42.53%, 29.23%, 15.25%, 21.52%, -2.35%.
-Referring to Table 3-6, what is the shape of the distribution for the rate of return?
(Short Answer)
4.8/5 (32)
TABLE 3-3
The ordered array below represents the number of vitamin supplements sold by a health food store in a sample of 16 days.
19, 19, 20, 20, 22, 23, 25, 26, 27, 30, 33, 34, 35, 36, 38, 41
Note: For this sample, the sum of the observations is 448, the sum of the squares of the observations is 13,356,
and the sum of the squared differences between each observation and the mean is 812.
-Referring to Table 3-3, the median number of vitamin supplements sold in this sample is ________.
(Short Answer)
4.9/5 (32)
The interquartile range is a measure of central tendency in a set of data.
(True/False)
4.9/5 (39)
According to the Chebyshev rule, at least 93.75% of all observations in any data set are contained within a distance of how many standard deviations around the mean?
(Multiple Choice)
4.9/5 (33)
TABLE 3-1
Health care issues are receiving much attention in both academic and political arenas. A sociologist recently conducted a survey of citizens over 60 years of age whose net worth is too high to qualify for Medicaid and have no private health insurance. The ages of 25 uninsured senior citizens were as follows:
 -Referring to Table 3-1, identify which of the following is the correct statement.
(Multiple Choice)
4.9/5 (30)
TABLE 3-2
The data below represent the amount of grams of carbohydrates in a serving of breakfast cereal in a sample of 11 different servings.
-Referring to Table 3-2, the arithmetic mean carbohydrates in this sample is ________ grams.
(Short Answer)
4.8/5 (35)
TABLE 3-10
The population of eight analysts at a software firm were asked to estimate the reuse rate when developing a new software system. The following data are given as a percentage of the total code written for a software system that is part of the reuse database.
50, 62.5, 37.5, 75.0, 45.0, 47.5, 15.0, 25.0
-Referring to Table 3-10, what is the mean percentage of the total code that is part of the reuse database?
(Short Answer)
4.7/5 (32)
TABLE 3-2
The data below represent the amount of grams of carbohydrates in a serving of breakfast cereal in a sample of 11 different servings.
-Referring to Table 3-2, the interquartile range in the carbohydrate amounts is ________ grams.
(Short Answer)
4.7/5 (37)
Data on the change in the cost of tuition, a shared dormitory room, and the most popular meal plan from the 2007-2008 academic year to the 2008-2009 academic year for a sample of 100 public universities are collected. Below is the boxplot for the change in cost in dollars. The distribution of the change in cost is 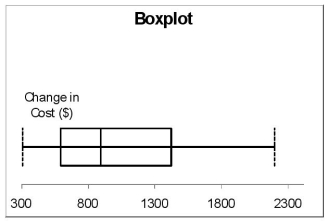
(Multiple Choice)
4.9/5 (35)
TABLE 3-4
The ordered array below represents the number of cargo manifests approved by customs inspectors of the Port of New York in a sample of 35 days:
16, 17, 18, 18, 19, 20, 20, 21, 21, 21, 22, 22, 22, 22, 23, 23, 23, 23, 24, 24, 24, 25, 25, 26, 26, 26, 27, 28, 28, 29, 29, 31, 31, 32, 32
Note: For this sample, the sum of the observations is 838, the sum of the squares of the observations is 20,684, and the sum of the squared differences between each observation and the mean is 619.89.
-Referring to Table 3-4, the five-number summary for the data in the customs sample consists of ________, ________, ________, ________, ________.
(Short Answer)
4.7/5 (33)
TABLE 3-4
The ordered array below represents the number of cargo manifests approved by customs inspectors of the Port of New York in a sample of 35 days:
16, 17, 18, 18, 19, 20, 20, 21, 21, 21, 22, 22, 22, 22, 23, 23, 23, 23, 24, 24, 24, 25, 25, 26, 26, 26, 27, 28, 28, 29, 29, 31, 31, 32, 32
Note: For this sample, the sum of the observations is 838, the sum of the squares of the observations is 20,684, and the sum of the squared differences between each observation and the mean is 619.89.
-Referring to Table 3-4, the interquartile range of the customs data is ________.
(Short Answer)
4.8/5 (49)
TABLE 3-7
In the 2009-2010 academic year, many public universities in the United States raised tuition and fees due to a decrease in state subsidies. The change in the cost of tuition, a shared dormitory room, and the most popular meal plan from the 2008-2009 academic year for a sample of 10 public universities were as follows: $1589, $593, $1223, $869, $423, $1720, $708, $1425, $922 and $308.
-Referring to Table 3-7, what are the (absolute values of) the Z scores of the change in cost?
(Essay)
4.7/5 (38)
TABLE 3-4
The ordered array below represents the number of cargo manifests approved by customs inspectors of the Port of New York in a sample of 35 days:
16, 17, 18, 18, 19, 20, 20, 21, 21, 21, 22, 22, 22, 22, 23, 23, 23, 23, 24, 24, 24, 25, 25, 26, 26, 26, 27, 28, 28, 29, 29, 31, 31, 32, 32
Note: For this sample, the sum of the observations is 838, the sum of the squares of the observations is 20,684, and the sum of the squared differences between each observation and the mean is 619.89.
-Referring to Table 3-4, the median of the customs data is ________.
(Short Answer)
4.9/5 (35)
A population with 200 elements has an arithmetic mean of 10. From this information, it can be shown that the population standard deviation is 15.
(True/False)
4.8/5 (39)
Filters
- Essay(0)
- Multiple Choice(0)
- Short Answer(0)
- True False(0)
- Matching(0)