Exam 16: Time-Series Analysis and Index Numbers
Exam 1: Instruction and Data Collection47 Questions
Exam 2: Presenting Data in Tables and Charts277 Questions
Exam 3: Numerical Descriptive Measures139 Questions
Exam 4: Basic Probability137 Questions
Exam 5: Some Important Discrete Probability Distributions188 Questions
Exam 6: The Normal Distribution and Other Continuous Distributions164 Questions
Exam 7: Sampling and Sampling Distributions187 Questions
Exam 8: Confidence Interval Estimation173 Questions
Exam 9: Fundamentals of Hypothesis Testing: One-Sample Tests146 Questions
Exam 10: Two-Sample Tests190 Questions
Exam 11: Analysis of Variance127 Questions
Exam 12: Chi-Square Tests and Nonparametric Tests174 Questions
Exam 13: Simple Linear Regression198 Questions
Exam 14: Introduction to Multiple Regression215 Questions
Exam 15: Multiple Regression Model Building101 Questions
Exam 16: Time-Series Analysis and Index Numbers133 Questions
Exam 17: Statistical Applications in Quality Management132 Questions
Exam 18: Data Analysis Overview52 Questions
Select questions type
TABLE 16-13
A local store developed a multiplicative time-series model to forecast its revenues in future quarters, using quarterly data on its revenues during the 4-year period from 2005 to 2009. The following is the resulting regression equation:

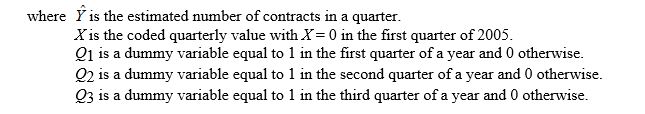 -Referring to Table 16-13, to obtain a forecast for the fourth quarter of 2006 using the model, which of the following sets of values should be used in the regression equation?
Free
(Multiple Choice)
4.9/5  (40)
(40)
Correct Answer: Verified
A
TABLE 16-3
The following table contains the number of complaints received in a department store for the first 6 months of last year.
 -Referring to Table 16-3, if a three-month moving average is used to smooth this series, how many values would it have?
Free
(Multiple Choice)
4.7/5 (35)
Correct Answer:Verified
C
The principle of parsimony indicates that the simplest model that gets the job done adequately should be used.
Free
(True/False)
4.7/5 (28)
Correct Answer:Verified
True
If a time series does not exhibit a long-term trend, the method of exponential smoothing may be used to obtain short-term predictions about the future.
(True/False)
4.8/5 (36)
The method of least squares may be used to estimate both linear and curvilinear trends.
(True/False)
4.7/5 (32)
TABLE 16-6
The number of cases of merlot wine sold by a Paso Robles winery in an 8-year period follows.
 -Referring to Table 16-6, exponential smoothing with a weight or smoothing constant of 0.4 will be used to smooth the wine sales. The value of E2, the smoothed value for 2002 is ________.
(Short Answer)
4.9/5 (29)
TABLE 16-9
The executive vice-president of a drug manufacturing firm believes that the demand for the firm's most popular drug has been evidencing an exponential trend since 1995. She uses Microsoft Excel to obtain the partial output below. The dependent variable is the log base 10 of the demand for the drug, while the independent variable is years, where 1995 is coded as 0, 1996 is coded as 1, etc.
SUMMARY OUTPUT
Regression Statistics

 -Referring to Table 16-9, the fitted trend value for 1995 is ________.
(Short Answer)
4.8/5 (38)
The effect of an unpredictable, rare event will be contained in the ________ component.
(Multiple Choice)
4.8/5 (39)
TABLE 16-5
A contractor developed a multiplicative time-series model to forecast the number of contracts in future quarters, using quarterly data on number of contracts during the 3-year period from 2006 to 2008. The following is the resulting regression equation:

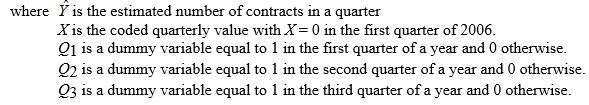 -Referring to Table 16-5, to obtain a forecast for the first quarter of 2009 using the model, which of the following sets of values should be used in the regression equation?
(Multiple Choice)
4.8/5 (38)
When using the exponentially weighted moving average for purposes of forecasting rather than smoothing,
(Multiple Choice)
5.0/5 (37)
Which of the following statements about the method of exponential smoothing is not true?
(Multiple Choice)
4.9/5 (46)
TABLE 16-7
The number of passengers arriving at San Francisco on the Amtrak cross-country express on 6 successive Mondays were: 60, 72, 96, 84, 36, and 48.
-Referring to Table 16-7, the number of arrivals will be smoothed with a 5-term moving average. The last smoothed value will be ________.
(Short Answer)
4.9/5 (39)
TABLE 16-11
Business closures in Laramie, Wyoming from 2003 to 2008 were:
 Microsoft Excel was used to fit both first-order and second-order autoregressive models, resulting in the following partial outputs:
SUMMARY OUTPUT - 2nd Order Model
Microsoft Excel was used to fit both first-order and second-order autoregressive models, resulting in the following partial outputs:
SUMMARY OUTPUT - 2nd Order Model
 SUMMARY OUTPUT - 1st Order Model
 -Referring to Table 16-11, the residuals for the second-order autoregressive model are ________, ________, ________, and ________.
(Short Answer)
4.9/5 (37)
TABLE 16-7
The number of passengers arriving at San Francisco on the Amtrak cross-country express on 6 successive Mondays were: 60, 72, 96, 84, 36, and 48.
-Referring to Table 16.7, exponentially smooth the number of arrivals using a smoothing constant of 0.1.
(Essay)
4.7/5 (26)
TABLE 16-6
The number of cases of merlot wine sold by a Paso Robles winery in an 8-year period follows.
-Referring to Table 16-6, a centered 3-year moving average is to be constructed for the wine sales. The result of this process will lead to a total of ________ moving averages.
(Short Answer)
4.9/5 (36)
To assess the adequacy of a forecasting model, one measure that is often used is
(Multiple Choice)
4.8/5 (31)
TABLE 16-5
A contractor developed a multiplicative time-series model to forecast the number of contracts in future quarters, using quarterly data on number of contracts during the 3-year period from 2006 to 2008. The following is the resulting regression equation:
-Referring to Table 16-5, the best interpretation of the coefficient of Q3 (0.617) in the regression equation is:
(Multiple Choice)
4.7/5 (39)
MAD is the summation of the residuals divided by the sample size.
(True/False)
4.9/5 (29)
TABLE 16-7
The number of passengers arriving at San Francisco on the Amtrak cross-country express on 6 successive Mondays were: 60, 72, 96, 84, 36, and 48.
-Referring to Table 16-7, exponentially smooth the number of arrivals using a smoothing constant of 0.25.
(Essay)
4.7/5 (38)
Filters
- Essay(0)
- Multiple Choice(0)
- Short Answer(0)
- True False(0)
- Matching(0)