Exam 8: Producers in the Long Run
Exam 1: Economic Issues and Concepts115 Questions
Exam 2: Economic Theories,data,and Graphs85 Questions
Exam 3: Demand,supply,and Price49 Questions
Exam 4: Elasticity45 Questions
Exam 5: Markets in Action39 Questions
Exam 6: Consumer Behaviour73 Questions
Exam 7: Producers in the Short Run114 Questions
Exam 8: Producers in the Long Run127 Questions
Exam 9: Competitive Markets73 Questions
Exam 10: Monopoly,cartels,and Price Discrimination113 Questions
Exam 11: Imperfect Competition and Strategic Behaviour115 Questions
Exam 12: Economic Efficiency and Public Policy115 Questions
Exam 13: How Factor Markets Work122 Questions
Exam 14: Labour Markets106 Questions
Exam 15: Interest Rates and the Capital Market91 Questions
Exam 16: Market Failures and Government Intervention110 Questions
Exam 17: The Economics of Environmental Protection109 Questions
Exam 18: Taxation and Public Expenditure100 Questions
Exam 33: The Gains From International Trade37 Questions
Exam 34: Trade Policy116 Questions
Select questions type
The figure below shows the isocost lines and the isoquant map for a firm producing golf tees.
 FIGURE 8- 6
-Refer to Figure 8- 6.Suppose this firm is producing 3000 golf tees and is at point F on the isoquant map.In order to maintain its output and minimize costs this firm should
FIGURE 8- 6
-Refer to Figure 8- 6.Suppose this firm is producing 3000 golf tees and is at point F on the isoquant map.In order to maintain its output and minimize costs this firm should
(Multiple Choice)
4.8/5  (42)
(42)
A short- run average total cost curve will touch the long- run average cost curve at a level of output only
(Multiple Choice)
4.9/5 (40)
A firm operates at its least- cost position for a given level of output by equating
(Multiple Choice)
4.9/5 (42)
The figure below shows a family of cost curves for a firm.The subscripts 1,2,and 3 for the SRATC curves refer to different plant sizes.
 FIGURE 8- 3
-Refer to Figure 8- 3.The minimum efficient scale is achieved by this firm at output level
FIGURE 8- 3
-Refer to Figure 8- 3.The minimum efficient scale is achieved by this firm at output level
(Multiple Choice)
4.9/5 (41)
The figure below shows the isocost lines and the isoquant map for a firm producing golf tees.
 FIGURE 8- 6
-Refer to Figure 8- 6.This firm will minimize its costs of producing 2000 golf tees at point
FIGURE 8- 6
-Refer to Figure 8- 6.This firm will minimize its costs of producing 2000 golf tees at point
(Multiple Choice)
4.7/5 (45)
FIGURE 8- 1  -Refer to Figure 8- 1.For which of the four firms in the figure is output increasing more than in proportion to inputs for all output levels?
(Multiple Choice)
4.8/5 (35)
Movement from one point to another along an isoquant implies a change in
(Multiple Choice)
4.8/5 (34)
By expressing the cost- minimizing condition as MPK/MPL = PK/PL,we are able to see
(Multiple Choice)
4.9/5 (37)
Suppose that capital costs $8 per unit and labour costs $4 per unit.For a profit- maximizing firm operating at its optimal factor mix,if the marginal product of capital is 60,the marginal product of labour must be
(Multiple Choice)
4.9/5 (39)
The table below shows the number of units of labour and capital used in 4 alternative production techniques for producing 1000 widgets per month. Technique A B C D Labour 25 35 50 30 Capital 50 35 25 60 TABLE 8- 1
-Refer to Table 8- 1.If the price of labour is $5 and the price of capital is $10,which production technique minimizes the costs of producing 1000 units of output?
(Multiple Choice)
4.8/5 (30)
Consider a firm in the long run that is trying to maximize its profits.It should
(Multiple Choice)
4.9/5 (37)
Suppose a firm is employing labour (L)and capital (K)such that MPK/MPL = PK/PL.If the price of labour rises,the cost- minimizing firm should
(Multiple Choice)
4.9/5 (37)
Movement from one point to another along an isocost line implies a change in
(Multiple Choice)
4.8/5 (43)
Which of the following conditions indicate cost minimization,assuming two inputs,labour (L)and capital (K)?
(Multiple Choice)
4.9/5 (28)
The figure below shows the isocost lines and the isoquant map for a firm producing golf tees.
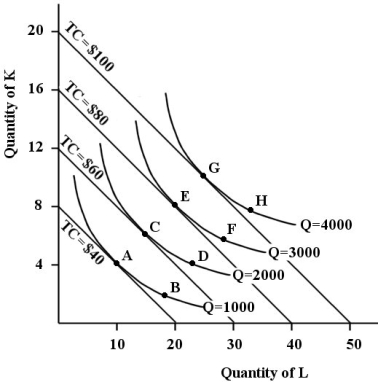 FIGURE 8- 6
-Refer to Figure 8- 6.As this firm is increasing its production of golf tees,it is experiencing returns to scale.
FIGURE 8- 6
-Refer to Figure 8- 6.As this firm is increasing its production of golf tees,it is experiencing returns to scale.
(Multiple Choice)
4.8/5 (39)
Assume a firm is using 10 units of capital and 10 units of labour to produce 10 widgets per hour.By doubling both inputs the result is a doubling of output.This firm is experiencing
(Multiple Choice)
4.8/5 (47)
The table below shows the number of units of labour and capital used in 4 alternative production techniques for producing 1000 widgets per month. Technique A B C D Labour 25 35 50 30 Capital 50 35 25 60 TABLE 8- 1
-Refer to Table 8- 1.Which production technique is obviously technically inefficient?
(Multiple Choice)
4.8/5 (41)
FIGURE 8- 4 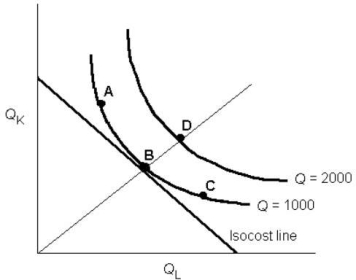 -Refer to Figure 8- 4,with the isoquants and isocost line as shown.A firm that is producing at point C can reduce its costs for producing 1000 units by employing
(Multiple Choice)
4.8/5 (39)
Suppose that a firm is using 100 units of labour and 50 units of capital to produce 200 completed client tax returns per day.The price of labour is $5 per unit and the price of capital is $2 per unit.The MPL equals 5 and the MPK equals 2.In this situation,the firm
(Multiple Choice)
4.7/5 (37)
FIGURE 8- 4
-Refer to Figure 8- 4,with the isoquants and isocost line as shown.A firm that is producing at point A can reduce its costs for producing 1000 units by employing
(Multiple Choice)
4.8/5 (42)
Filters
- Essay(0)
- Multiple Choice(0)
- Short Answer(0)
- True False(0)
- Matching(0)