Exam 10: Aggregate Supply and Aggregate Demand
Exam 1: What Is Economics644 Questions
Exam 2: The Economic Problem503 Questions
Exam 3: Demand and Supply558 Questions
Exam 4: Measuring Gdp and Economic Growth375 Questions
Exam 5: Monitoring Jobs and Inflation434 Questions
Exam 6: Economic Growth450 Questions
Exam 7: Finance, Saving, and Investment260 Questions
Exam 8: Money, the Price Level, and Inflation616 Questions
Exam 9: The Exchange Rate and the Balance of Payments547 Questions
Exam 10: Aggregate Supply and Aggregate Demand452 Questions
Exam 11: Expenditure Multipliers: They Keynesian Model484 Questions
Exam 12: U.S. Inflation, Unemployment, and Business Cycle443 Questions
Exam 13: Fiscal Policy328 Questions
Exam 14: Monetary Policy284 Questions
Exam 15: International Trade Policy207 Questions
Select questions type
When real GDP exceeds potential GDP, then the economy is in
(Multiple Choice)
4.8/5  (28)
(28)
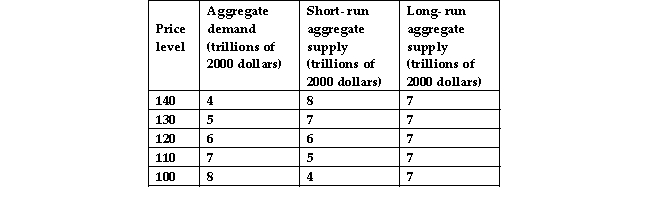 -The data in the above table show that when the price level is 120, the economy
(Multiple Choice)
5.0/5 (38)
The level of output at which the short- run aggregate supply curve and the aggregate demand curve intersect is the full employment level of GDP.
(True/False)
4.9/5 (30)
In the short run, a supply shock that shifts the short- run aggregate supply curve leftward raises the price level and decreases real GDP.
(True/False)
4.8/5 (35)
Which of the following shifts the aggregate demand curve rightward?
(Multiple Choice)
4.8/5 (41)
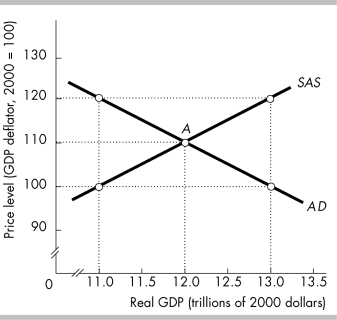 -In the above figure, the economy is at point A when changes occur. If the new equilibrium has a price level of 100 and real GDP of $13.0 trillion, then it must be the case that
(Multiple Choice)
4.8/5 (30)
 -The data in the above table indicate that when the price level is 120,
(Multiple Choice)
4.8/5 (30)
The equilibrium level of GDP occurs at the level of GDP at which the
(Multiple Choice)
4.8/5 (28)
If the world economy expands so that foreign demand for U.S.- made goods increases, in the short run what will happen to aggregate demand, the price level, and real GDP in the U.S.?
(Essay)
4.7/5 (30)
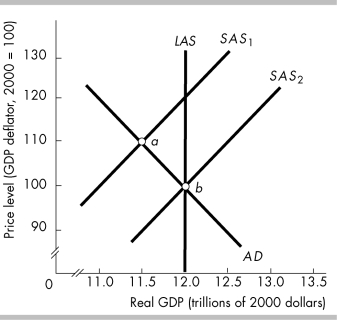 -In the above figure, if the economy moves from point a to point b,
(Multiple Choice)
4.8/5 (29)
When the economy is at an above full- employment equilibrium, .
(Multiple Choice)
4.8/5 (39)
The short- run aggregate supply curve shifts leftward when the
(Multiple Choice)
4.9/5 (37)
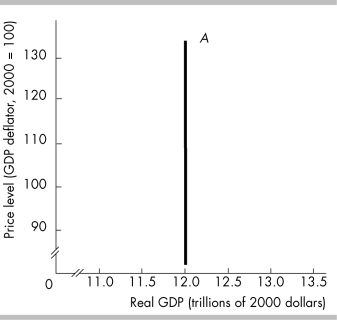 -The curve labeled A in the above figure will shift rightward when
(Multiple Choice)
4.7/5 (40)
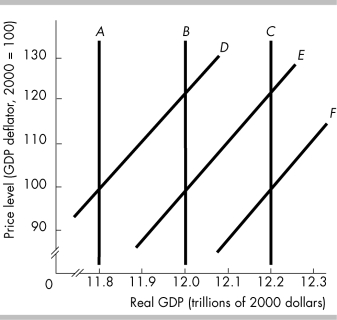 -In the above figure, B is the current long- run aggregate supply curve and E is the current short- run aggregate supply curve. If there is an increase in the full- employment quantity of labor, then the long- run aggregate supply curve and the short- run aggregate supply curve
(Multiple Choice)
4.8/5 (40)
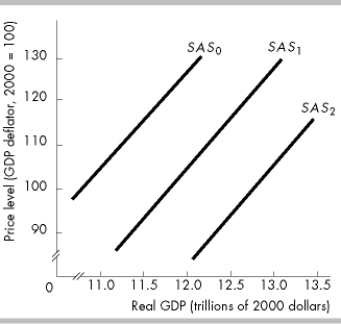 -In the above figure, the short- run aggregate supply curve is SAS1. If the prices of resources fall, there is
(Multiple Choice)
4.9/5 (48)
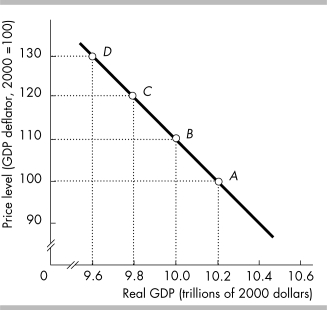 -In the above figure, the economy is initially at point B. Then the price level falls by 10. The wealth effect will help
(Multiple Choice)
4.8/5 (36)
Filters
- Essay(0)
- Multiple Choice(0)
- Short Answer(0)
- True False(0)
- Matching(0)