Exam 10: Aggregate Supply and Aggregate Demand
Exam 1: What Is Economics644 Questions
Exam 2: The Economic Problem503 Questions
Exam 3: Demand and Supply558 Questions
Exam 4: Measuring Gdp and Economic Growth375 Questions
Exam 5: Monitoring Jobs and Inflation434 Questions
Exam 6: Economic Growth450 Questions
Exam 7: Finance, Saving, and Investment260 Questions
Exam 8: Money, the Price Level, and Inflation616 Questions
Exam 9: The Exchange Rate and the Balance of Payments547 Questions
Exam 10: Aggregate Supply and Aggregate Demand452 Questions
Exam 11: Expenditure Multipliers: They Keynesian Model484 Questions
Exam 12: U.S. Inflation, Unemployment, and Business Cycle443 Questions
Exam 13: Fiscal Policy328 Questions
Exam 14: Monetary Policy284 Questions
Exam 15: International Trade Policy207 Questions
Select questions type
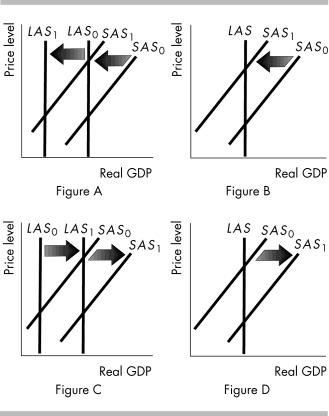 -In the above figure, which part corresponds to a fall in the money wage rate?
(Multiple Choice)
4.9/5  (41)
(41)
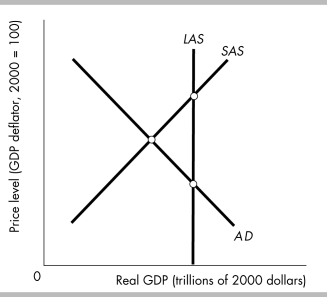
In the short run, the intersection of the aggregate demand and the short- run aggregate supply curves,
(Multiple Choice)
4.9/5 (33)
We distinguish between the long- run aggregate supply curve and the short- run aggregate supply curve. In the long run
(Multiple Choice)
4.8/5 (42)
In 2008, the Bank of England increased the country's money supply and lowered its interest rate. This policy was designed to
(Multiple Choice)
4.7/5 (33)
The business cycle is actually a continuous series of different .
(Multiple Choice)
4.8/5 (39)
Which of the following helps determine the growth rate of potential GDP?
I. capital accumulation
II. technology advances
III. the money supply
(Multiple Choice)
4.8/5 (29)
According to the intertemporal substitution effect, when the price level increases, the interest rate
(Multiple Choice)
4.8/5 (44)
 -In the above figure, if aggregate demand does not change the short- run equilibrium will
(Multiple Choice)
4.8/5 (36)
-In the above figure, which part corresponds to an increase in the money wage rate?
(Multiple Choice)
4.8/5 (42)
A movement along the aggregate demand curve but not a shift in the aggregate demand curve is created by
(Multiple Choice)
4.9/5 (34)
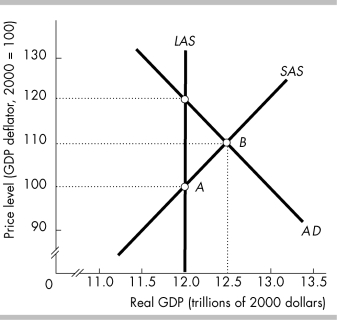 -In the above figure, suppose the economy had been at point A and now is at B. What could have lead to the movement to B?
(Multiple Choice)
4.7/5 (39)
The aggregate demand curve shows that, if other factors are held constant, the higher the price level, the
(Multiple Choice)
4.9/5 (35)
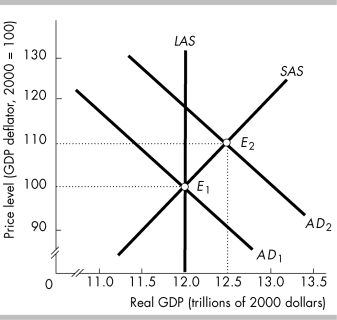 -The reason that it is possible for the economy in the above figure to be at equilibrium E2 rather than at E1 is that
(Multiple Choice)
4.8/5 (31)
All of the following shift the short- run aggregate supply curve EXCEPT
(Multiple Choice)
4.9/5 (39)
The short- run aggregate supply curve is upward sloping because
(Multiple Choice)
4.8/5 (31)
 -An inflationary gap means that short- run macroeconomic equilibrium GDP
(Multiple Choice)
4.9/5 (34)
What are fiscal and monetary policies? Do they have an immediate effect on the AD curve or the SAS curve?
(Essay)
4.9/5 (41)
When the price level in France increases while the exchange rate and the price level in the United States remain the same, the result is
(Multiple Choice)
4.9/5 (41)
Filters
- Essay(0)
- Multiple Choice(0)
- Short Answer(0)
- True False(0)
- Matching(0)