Exam 10: Aggregate Supply and Aggregate Demand
Exam 1: What Is Economics644 Questions
Exam 2: The Economic Problem503 Questions
Exam 3: Demand and Supply558 Questions
Exam 4: Measuring Gdp and Economic Growth375 Questions
Exam 5: Monitoring Jobs and Inflation434 Questions
Exam 6: Economic Growth450 Questions
Exam 7: Finance, Saving, and Investment260 Questions
Exam 8: Money, the Price Level, and Inflation616 Questions
Exam 9: The Exchange Rate and the Balance of Payments547 Questions
Exam 10: Aggregate Supply and Aggregate Demand452 Questions
Exam 11: Expenditure Multipliers: They Keynesian Model484 Questions
Exam 12: U.S. Inflation, Unemployment, and Business Cycle443 Questions
Exam 13: Fiscal Policy328 Questions
Exam 14: Monetary Policy284 Questions
Exam 15: International Trade Policy207 Questions
Select questions type
With an increase in the capital stock, the short- run aggregate supply curve
(Multiple Choice)
4.7/5  (49)
(49)
The aggregate supply/aggregate demand model is used to help understand all of the following EXCEPT
(Multiple Choice)
4.7/5 (37)
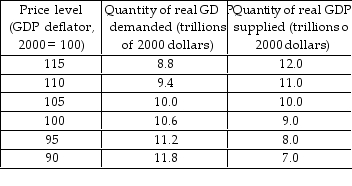 -Based on the table above,
a) What is the equilibrium price level and real GDP?
b) If potential GDP is $11.0 trillion, what does that imply about the economy's level of employment?
c) If potential GDP is $9.0 trillion, what does that imply about the economy's level of employment?
-Based on the table above,
a) What is the equilibrium price level and real GDP?
b) If potential GDP is $11.0 trillion, what does that imply about the economy's level of employment?
c) If potential GDP is $9.0 trillion, what does that imply about the economy's level of employment?
(Essay)
4.8/5 (31)
 -In the above figure, the aggregate demand curve is AD2, so the short- run equilibrium level of real GDP is
(Multiple Choice)
4.8/5 (30)
Assume the economy is at long run equilibrium and oil prices rise. As a result, the shifts
)
(Multiple Choice)
4.8/5 (38)
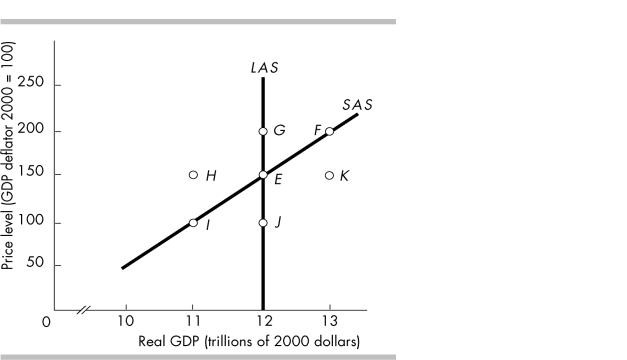 -In the above figure, which movement illustrates the impact of a constant price level and a rising money wage rate?
(Multiple Choice)
4.7/5 (40)
A decrease in short- run aggregate supply the equilibrium price level and the equilibrium quantity of real GDP.
(Multiple Choice)
4.8/5 (36)
The short- run aggregate supply curve shows a positive relationship between the price level and real GDP.
(True/False)
5.0/5 (44)
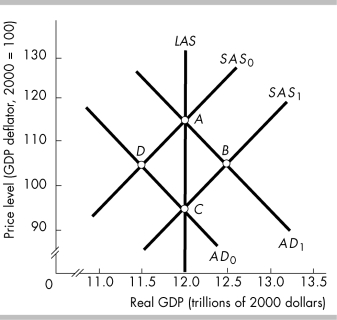 -The economy is initially at point A in the figure. An increase in _ will move the economy to point and then an increase in will move the economy to point .
(Multiple Choice)
4.9/5 (45)
points out that a rise in the price level decreases the value of real wealth, which then decreases consumption.
(Multiple Choice)
4.8/5 (43)
 -In the above figure, the movement from point B to point A might be the result of
(Multiple Choice)
4.9/5 (32)
Assume the equilibrium price level is 140 and the equilibrium real GDP is $15 trillion. What happens if the current price level equals 125?
(Essay)
4.9/5 (35)
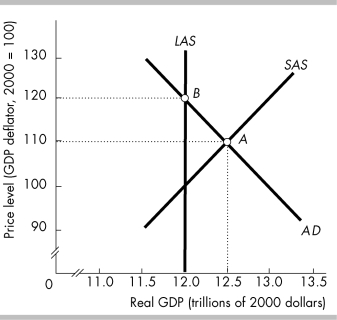 -In the above figure, if the economy is at point A, which of the following is true?
(Multiple Choice)
4.7/5 (48)
Suppose the value of the U.S. dollar decreases from $1.20 Canadian to $1.10 Canadian. U.S. exports will _ _, U.S. imports will , and U.S. aggregate demand will .
(Multiple Choice)
5.0/5 (38)
In a short- run macroeconomic equilibrium, real GDP exceeds potential GDP, so if aggregate demand does not change the
(Multiple Choice)
4.7/5 (42)
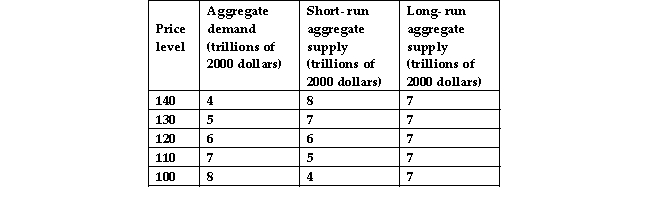 -The data in the above table show that when the price level is 120, if aggregate demand does not change then the
(Multiple Choice)
4.8/5 (36)
Filters
- Essay(0)
- Multiple Choice(0)
- Short Answer(0)
- True False(0)
- Matching(0)