Exam 10: Aggregate Supply and Aggregate Demand
Exam 1: What Is Economics472 Questions
Exam 2: The Economic Problem432 Questions
Exam 3: Demand and Supply503 Questions
Exam 4: Measuring Gdp and Economic Growth393 Questions
Exam 5: Monitoring Jobs and Inflation398 Questions
Exam 6: Economic Growth343 Questions
Exam 7: Finance, Saving, and Investment233 Questions
Exam 8: Money, the Price Level, and Inflation583 Questions
Exam 9: The Exchange Rate and the Balance of Payments482 Questions
Exam 10: Aggregate Supply and Aggregate Demand411 Questions
Exam 11: Expenditure Multipliers: the Keynesian Model444 Questions
Exam 12: U.S Inflation, Unemployment, and Business Cycle391 Questions
Exam 13: Fiscal Policy251 Questions
Exam 14: Monetary Policy216 Questions
Exam 15: International Trade Policy187 Questions
Review101 Questions
Select questions type
Substitution effects help explain the slope of the aggregate demand curve. One substitution effect refers to the
(Multiple Choice)
4.7/5  (33)
(33)
People expect that the El Nino effect will cause drought in Australia in coming years. If most Australian firms expect their profits will fall during the next five years, Australiaʹs __________this year.
(Multiple Choice)
4.7/5 (40)
In the United States, during the past 5 decades economic growth was most rapid during the____________
(Multiple Choice)
4.9/5 (36)
Price level A ggregate demand (trillions of 2005 dollars) Short-run aggregate supply (trillions of 2005 dollars) Long-run aggregate supply (trilli ons of 2005 dollars) 100 11 7 10 110 10 8 10 120 9 9 10 130 8 10 10 140 7 11 10
-Based on the data in the table above, at the short-run equilibrium
(Multiple Choice)
5.0/5 (39)
In 2008, Japanʹs economy suffered as world economies slowed. If authorities in Japan followed the monetarist viewpoint,___________ to bring the economy back to full employment.
(Multiple Choice)
4.9/5 (31)
Moving upward along the SAS results in a ___________ in the price level and___________ in real GDP.
(Multiple Choice)
4.9/5 (36)
In the short run, a supply shock that shifts the short-run aggregate supply curve leftward raises the price level and increases real GDP.
(True/False)
4.8/5 (49)
Suppose that the economy begins at a long-run equilibrium. Which of the following raises the price level and decrease real GDP in the short run?
(Multiple Choice)
4.9/5 (30)
Price level A ggregate demand (trillions of 2005 dollars) Short-run aggregate supply (trillions of 2005 dollars) Long-run aggregate supply (trilli ons of 2005 dollars) 100 11 7 10 110 10 8 10 120 9 9 10 130 8 10 10 140 7 11 10
-Based on the data in the table above, in the adjustment towards the long -run equilibrium
(Multiple Choice)
4.7/5 (36)
Price level A ggregate demand (trillions of 2005 dollars) Short-run aggregate supply (trillions of 2005 dollars) Long-run aggregate supply (trillions of 2005 dollars) 100 13 9 10 105 12 10 10 110 11 11 10 115 10 13 10
-Using the data in the above table, in the short-run macroeconomic equilibrium, the price level is____________ and the level of real GDP is____________ .
(Multiple Choice)
4.8/5 (39)
In Japan in 2000 the price level fell by 5 percent and nominal wage rates did not change. As a result, there was a
(Multiple Choice)
4.7/5 (49)
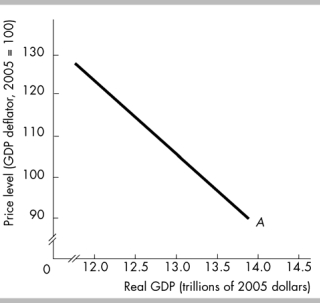 -In the above figure, the curve labeled A shifts rightward if
(Multiple Choice)
4.9/5 (45)
Which of the following directly shifts the short-run aggregate supply curve?
(Multiple Choice)
4.9/5 (46)
Which of the following does NOT shift the short-run aggregate supply curve?
(Multiple Choice)
4.8/5 (32)
Filters
- Essay(0)
- Multiple Choice(0)
- Short Answer(0)
- True False(0)
- Matching(0)