Exam 10: Aggregate Supply and Aggregate Demand
Exam 1: What Is Economics472 Questions
Exam 2: The Economic Problem432 Questions
Exam 3: Demand and Supply503 Questions
Exam 4: Measuring Gdp and Economic Growth393 Questions
Exam 5: Monitoring Jobs and Inflation398 Questions
Exam 6: Economic Growth343 Questions
Exam 7: Finance, Saving, and Investment233 Questions
Exam 8: Money, the Price Level, and Inflation583 Questions
Exam 9: The Exchange Rate and the Balance of Payments482 Questions
Exam 10: Aggregate Supply and Aggregate Demand411 Questions
Exam 11: Expenditure Multipliers: the Keynesian Model444 Questions
Exam 12: U.S Inflation, Unemployment, and Business Cycle391 Questions
Exam 13: Fiscal Policy251 Questions
Exam 14: Monetary Policy216 Questions
Exam 15: International Trade Policy187 Questions
Review101 Questions
Select questions type
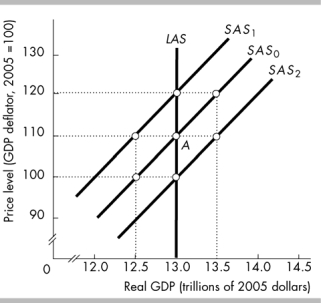 -In the above figure, the economy is at point A and the money wage rate falls by 10 percent. If the price level is constant, firms will be willing to supply output equal to
(Multiple Choice)
5.0/5  (40)
(40)
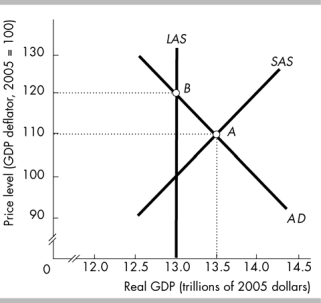
 -In the above figure, the short-run aggregate supply curve is SAS and the aggregate demand curve is AD. A recessionary gap exists
(Multiple Choice)
4.8/5 (34)
The U.S. fiscal policy implemented in 2008 was an attempt to
(Multiple Choice)
4.8/5 (33)
If the money prices of resources changes, the SAS curve shifts.
(True/False)
4.8/5 (36)
Aggregate demand increases if the quantity of money__________ .
(Multiple Choice)
4.9/5 (42)
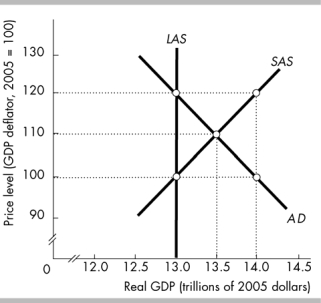 -In the above figure, as the economy adjusts toward equilibrium, the
(Multiple Choice)
4.7/5 (33)
A technological advance the long -run aggregate supply curve and the short-run aggregate supply curve.
(Multiple Choice)
4.8/5 (37)
 -In the above figure, if the economy is at point A, which of the following is true?
(Multiple Choice)
4.8/5 (32)
The Keynesian theory of business cycle views volatile expectations of future sales and profits as the main source of economic fluctuations.
(True/False)
4.8/5 (38)
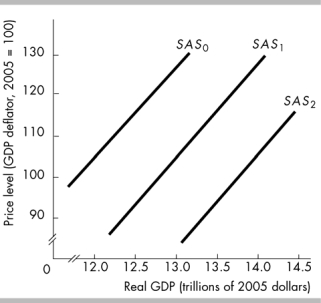 -In the above figure, the short-run aggregate supply curve is SAS1. If the money wage rate increases, there is
(Multiple Choice)
4.9/5 (30)
The long-run aggregate supply curve is vertical at $12 trillion but the short-run aggregate supply curve intersects the aggregate demand curve at $13 trillion. We know that
(Multiple Choice)
4.9/5 (42)
The U.S. monetary policy implemented in 2008 was an attempt to
(Multiple Choice)
4.8/5 (39)
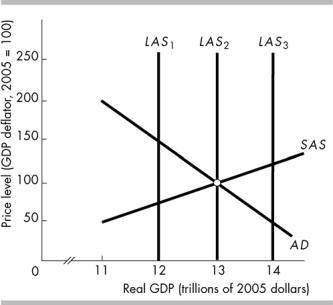
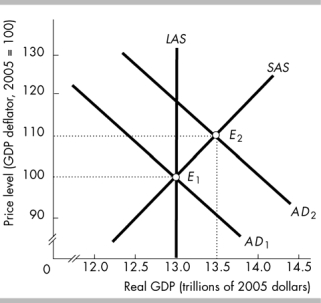 -The reason that it is possible for the economy in the above figure to be at equilibrium E2 rather than at E1 is that
(Multiple Choice)
4.8/5 (49)
In the aggregate demand-aggregate supply framework, how does an increase in the price level affect potential GDP?
(Essay)
4.8/5 (36)
Filters
- Essay(0)
- Multiple Choice(0)
- Short Answer(0)
- True False(0)
- Matching(0)