Exam 10: Aggregate Supply and Aggregate Demand
Exam 1: What Is Economics472 Questions
Exam 2: The Economic Problem432 Questions
Exam 3: Demand and Supply503 Questions
Exam 4: Measuring Gdp and Economic Growth393 Questions
Exam 5: Monitoring Jobs and Inflation398 Questions
Exam 6: Economic Growth343 Questions
Exam 7: Finance, Saving, and Investment233 Questions
Exam 8: Money, the Price Level, and Inflation583 Questions
Exam 9: The Exchange Rate and the Balance of Payments482 Questions
Exam 10: Aggregate Supply and Aggregate Demand411 Questions
Exam 11: Expenditure Multipliers: the Keynesian Model444 Questions
Exam 12: U.S Inflation, Unemployment, and Business Cycle391 Questions
Exam 13: Fiscal Policy251 Questions
Exam 14: Monetary Policy216 Questions
Exam 15: International Trade Policy187 Questions
Review101 Questions
Select questions type
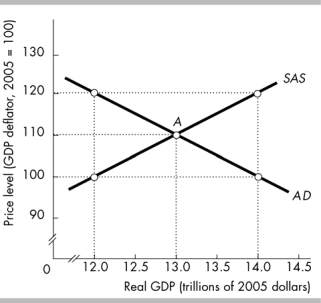 -In the above figure, the economy is at point A when changes occur. If the new equilibrium has a price level of 100 and real GDP of $14.0 trillion, then it must be the case that
(Multiple Choice)
4.9/5  (41)
(41)
 -In the above figure, if the economy is at point A, which of the following is true?
(Multiple Choice)
4.7/5 (47)
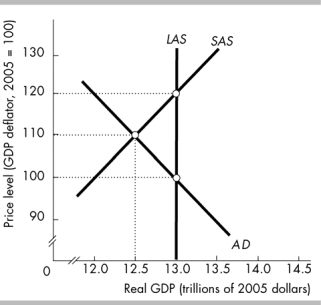
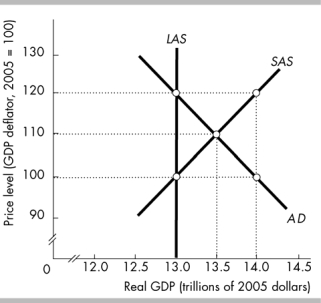 -In the above figure, when the economy is in a long-run equilibrium, the price level will be
(Multiple Choice)
4.7/5 (36)
A decrease in the price level accompanied by no change in the money wage rate leads to ____________ Movement along the ____________aggregate supply curve.
(Multiple Choice)
4.9/5 (36)
 -In the figure above, the economy is at point A when the price level rises to 120. Money wage rates and other resource prices remain constant. Firms are willing to supply output equal to
(Multiple Choice)
5.0/5 (37)
In recent years, Japanʹs capital stock has increased by about 6 percent from one year to the next. As a result, we would expect
(Multiple Choice)
4.8/5 (39)
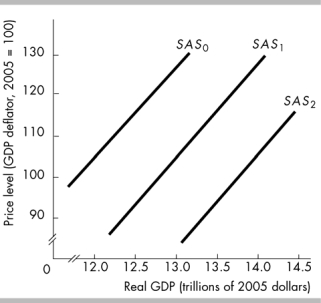 -In the above figure, the short-run aggregate supply curve is SAS1. If technology advances, there is
(Multiple Choice)
4.8/5 (32)
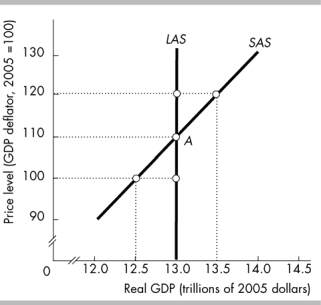
 -In the above figure, if aggregate demand does not change the short -run equilibrium will
(Multiple Choice)
4.9/5 (35)
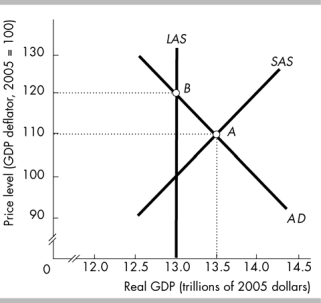
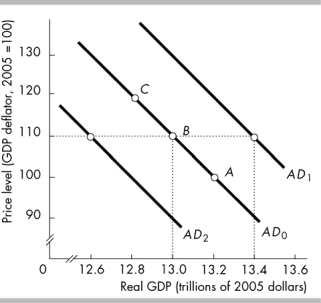 -In the above figure, the economy is initially at point B. If the Fed increases the quantity of money, there is
(Multiple Choice)
4.8/5 (44)
Moving along the short-run aggregate supply curve,___________
(Multiple Choice)
4.8/5 (36)
According to the intertemporal substitution effect, when the price level increases, the interest rate
(Multiple Choice)
4.9/5 (32)
Assume the economy is at long run equilibrium and oil prices rise. As a result, the ____________ shifts____________
(Multiple Choice)
4.9/5 (34)
An economy is at full employment. Which of the following events can create a recessionary gap?
(Multiple Choice)
4.8/5 (31)
When the prices of U.S.-produced goods rise and the price of foreign-produced goods do not change , the result is
(Multiple Choice)
4.8/5 (39)
 -In the figure above, in the short-run macroeconomic equilibrium,
(Multiple Choice)
4.9/5 (35)
What happens to the aggregate demand curve in the United States if the exchange rate increases so that U.S.-made products become more expensive?
(Essay)
4.8/5 (35)
Filters
- Essay(0)
- Multiple Choice(0)
- Short Answer(0)
- True False(0)
- Matching(0)