Exam 2: Economic Theories, Data, and Graphs
Exam 1: Economic Issues and Concepts130 Questions
Exam 2: Economic Theories, Data, and Graphs140 Questions
Exam 3: Demand, Supply, and Price161 Questions
Exam 4: Elasticity160 Questions
Exam 5: Price Controls and Market Efficiency125 Questions
Exam 6: Consumer Behaviour140 Questions
Exam 7: Producers in the Short Run144 Questions
Exam 8: Producers in the Long Run141 Questions
Exam 9: Competitive Markets153 Questions
Exam 10: Monopoly, Cartels, and Price Discrimination126 Questions
Exam 11: Imperfect Competition and Strategic Behaviour126 Questions
Exam 12: Economic Efficiency and Public Policy123 Questions
Exam 13: How Factor Markets Work124 Questions
Exam 14: Labour Markets and Income Inequality117 Questions
Exam 16: Market Failures and Government Intervention123 Questions
Exam 17: The Economics of Environmental Protection133 Questions
Exam 18: Taxation and Public Expenditure121 Questions
Exam 19: What Macroeconomics Is All About116 Questions
Exam 20: The Measurement of National Income117 Questions
Exam 21: The Simplest Short-Run Macro Model156 Questions
Exam 22: Adding Government and Trade to the Simple Macro Model132 Questions
Exam 23: Output and Prices in the Short Run142 Questions
Exam 24: From the Short Run to the Long Run: the Adjustment of Factor Prices148 Questions
Exam 25: Long-Run Economic Growth132 Questions
Exam 26: Money and Banking119 Questions
Exam 27: Money, Interest Rates, and Economic Activity135 Questions
Exam 28: Monetary Policy in Canada122 Questions
Exam 29: Inflation and Disinflation123 Questions
Exam 30: Unemployment Fluctuations and the Nairu120 Questions
Exam 31: Government Debt and Deficits129 Questions
Exam 32: The Gains From International Trade127 Questions
Exam 33: Trade Policy126 Questions
Exam 34: Exchange Rates and the Balance of Payments161 Questions
Select questions type
The table below shows hypothetical data for the volume of gold and nickel output across several years.  TABLE 2-5
-Refer to Table 2-5. What is the index number for nickel output in Year 6?
TABLE 2-5
-Refer to Table 2-5. What is the index number for nickel output in Year 6?
(Multiple Choice)
4.9/5  (41)
(41)
Suppose we have data for 1000 students for a period of one year. The data show that those students who spend more hours studying have a higher grade point average GPA). We can say that
(Multiple Choice)
4.7/5 (33)
An assertion about the desirability of reducing unemployment by lowering payroll taxes is most likely
(Multiple Choice)
4.8/5 (31)
The table below shows hypothetical prices for a particular anatomy textbook at a university bookstore over several years. 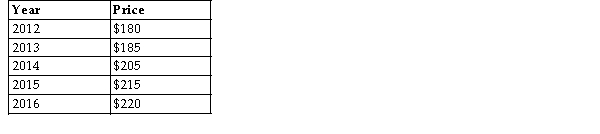 TABLE 2-4
-Refer to Table 2-4. The increase in the price of the textbook from 2012 to 2016 is
TABLE 2-4
-Refer to Table 2-4. The increase in the price of the textbook from 2012 to 2016 is
(Multiple Choice)
4.8/5 (38)
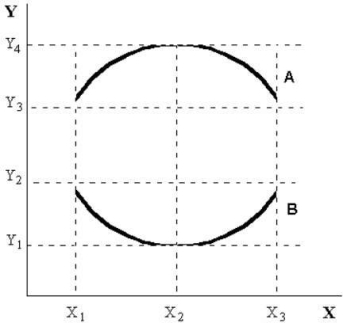 FIGURE 2-3
-At the minimum or the maximum of the graph of a non-linear function with x on the horizontal axis and y on the vertical axis) the marginal response of y to a small change in x is
FIGURE 2-3
-At the minimum or the maximum of the graph of a non-linear function with x on the horizontal axis and y on the vertical axis) the marginal response of y to a small change in x is
(Multiple Choice)
4.9/5 (34)
On a coordinate graph with y on the vertical axis and x on the horizontal axis, suppose point A represents coordinates X = 5, Y = 6) and point B represents coordinates X = 2, Y = 3). Then the slope of the straight line joining points A and B is
(Multiple Choice)
4.8/5 (38)
Suppose an individual wheat farmerʹs income is influenced by the regionʹs average daily temperature. When examining the determinants of individual farmer income, the average daily temperature is an) variable.
(Multiple Choice)
4.9/5 (38)
Which of the following pairs of words have similar meanings?
(Multiple Choice)
4.8/5 (37)
Suppose economists at the World Bank discover a positive correlation between family income and female education levels in developing countries. We can say that
(Multiple Choice)
4.9/5 (36)
The table below shows hypothetical data for volumes of e-books and hardcover books sold over a 3-year period in a particular city. 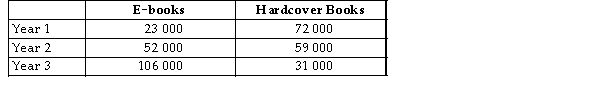 TABLE 2-3
-Refer to Table 2-3. Between Year 1 and Year 3, what is the percentage change in sales of e -books?
TABLE 2-3
-Refer to Table 2-3. Between Year 1 and Year 3, what is the percentage change in sales of e -books?
(Multiple Choice)
4.7/5 (42)
The table below shows hypothetical tuition costs at a Canadian university. 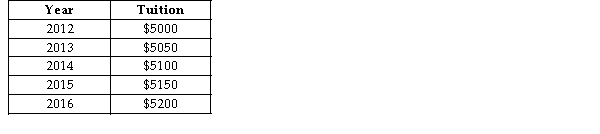 TABLE 2-1
-Refer to Table 2-1. Assume that 2012 is used as the base year, with the index number = 100. The value of the index number in 2014 is calculated as follows:
TABLE 2-1
-Refer to Table 2-1. Assume that 2012 is used as the base year, with the index number = 100. The value of the index number in 2014 is calculated as follows:
(Multiple Choice)
4.9/5 (37)
The table below shows hypothetical prices for a particular anatomy textbook at a university bookstore over several years. TABLE 2-4
-Refer to Table 2-4. Assume that 2016 is used as the base year, with the index number = 100. The value of the index number in 2012 is
(Multiple Choice)
4.8/5 (38)
 FIGURE 2-1
-Suppose Ahmoud would spend $1200 per year on travel, even if his annual income were zero. As his income rises, he would spend 20% of each additional dollar of income on travel. Choose the correct mathematical equation that describes the functional relation between his travel spending T) and his income Y).
FIGURE 2-1
-Suppose Ahmoud would spend $1200 per year on travel, even if his annual income were zero. As his income rises, he would spend 20% of each additional dollar of income on travel. Choose the correct mathematical equation that describes the functional relation between his travel spending T) and his income Y).
(Multiple Choice)
4.7/5 (35)
Data collected repeatedly over successive periods of time are called
(Multiple Choice)
4.8/5 (40)
If we seek to explain the number of seats sold on a particular air route, say Toronto to Halifax, over a one -year period, we would consider many variables. Which of the following variables would be endogenous to our theory?
(Multiple Choice)
4.8/5 (45)
When studying economic data, and when comparing the magnitude of changes in variables with different scales it is best to
(Multiple Choice)
4.7/5 (43)
Filters
- Essay(0)
- Multiple Choice(0)
- Short Answer(0)
- True False(0)
- Matching(0)