Exam 2: Economic Theories, Data, and Graphs
Exam 1: Economic Issues and Concepts130 Questions
Exam 2: Economic Theories, Data, and Graphs140 Questions
Exam 3: Demand, Supply, and Price161 Questions
Exam 4: Elasticity160 Questions
Exam 5: Price Controls and Market Efficiency125 Questions
Exam 6: Consumer Behaviour140 Questions
Exam 7: Producers in the Short Run144 Questions
Exam 8: Producers in the Long Run141 Questions
Exam 9: Competitive Markets153 Questions
Exam 10: Monopoly, Cartels, and Price Discrimination126 Questions
Exam 11: Imperfect Competition and Strategic Behaviour126 Questions
Exam 12: Economic Efficiency and Public Policy123 Questions
Exam 13: How Factor Markets Work124 Questions
Exam 14: Labour Markets and Income Inequality117 Questions
Exam 16: Market Failures and Government Intervention123 Questions
Exam 17: The Economics of Environmental Protection133 Questions
Exam 18: Taxation and Public Expenditure121 Questions
Exam 19: What Macroeconomics Is All About116 Questions
Exam 20: The Measurement of National Income117 Questions
Exam 21: The Simplest Short-Run Macro Model156 Questions
Exam 22: Adding Government and Trade to the Simple Macro Model132 Questions
Exam 23: Output and Prices in the Short Run142 Questions
Exam 24: From the Short Run to the Long Run: the Adjustment of Factor Prices148 Questions
Exam 25: Long-Run Economic Growth132 Questions
Exam 26: Money and Banking119 Questions
Exam 27: Money, Interest Rates, and Economic Activity135 Questions
Exam 28: Monetary Policy in Canada122 Questions
Exam 29: Inflation and Disinflation123 Questions
Exam 30: Unemployment Fluctuations and the Nairu120 Questions
Exam 31: Government Debt and Deficits129 Questions
Exam 32: The Gains From International Trade127 Questions
Exam 33: Trade Policy126 Questions
Exam 34: Exchange Rates and the Balance of Payments161 Questions
Select questions type
When considering how a familyʹs level of consumption changes in response to changes in its income,
(Multiple Choice)
4.9/5  (30)
(30)
The table below shows the approximate value of Canadaʹs crude oil and natural gas exports over a 5 -year period. The amounts shown are billions of dollars. 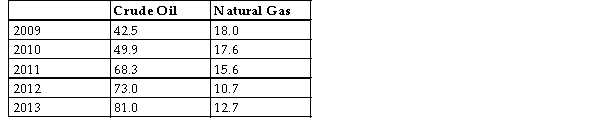 TABLE 2-7
-Refer to Table 2-7. Assume that 2009 is the base year, with an index number = 100. What is the percentage change in the value of exports of natural gas from 2009 to 2013?
TABLE 2-7
-Refer to Table 2-7. Assume that 2009 is the base year, with an index number = 100. What is the percentage change in the value of exports of natural gas from 2009 to 2013?
(Multiple Choice)
4.9/5 (36)
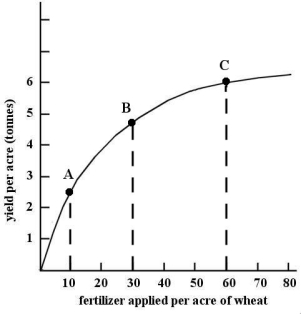 FIGURE 2-4
-Refer to Figure 2-4. The functional relation shown between fertilizer applied and wheat yield can be described as a
FIGURE 2-4
-Refer to Figure 2-4. The functional relation shown between fertilizer applied and wheat yield can be described as a
(Multiple Choice)
4.8/5 (39)
On a coordinate graph with y on the vertical axis and x on the horizontal axis, suppose point A represents coordinates X = 2, Y = 12) and point B represents coordinates X = 6, Y = 4). The slope of the straight line joining points A and B is
(Multiple Choice)
4.8/5 (35)
Of the following, which is the most important characteristic of a successful theory?
(Multiple Choice)
4.9/5 (35)
Choose the statement that best characterizes an economic theory. A valid theory
(Multiple Choice)
4.9/5 (33)
The table below shows the approximate value of Canadaʹs crude oil and natural gas exports over a 5 -year period. The amounts shown are billions of dollars. TABLE 2-7
-Refer to Table 2-7. Assume that 2009 is the base year, with an index number = 100. What is the percentage change in the value of exports of crude oil from 2009 to 2013?
(Multiple Choice)
4.8/5 (34)
Which of the following statements belongs more properly in the field of normative economics than positive economics?
(Multiple Choice)
4.9/5 (34)
The table below shows the approximate value of Canadaʹs crude oil and natural gas exports over a 5 -year period. The amounts shown are billions of dollars. TABLE 2-7
-Refer to Table 2-7. Assume that 2009 is the base year, with an index number = 100. What is the percentage change in the value of exports of crude oil from 2012 to 2013?
(Multiple Choice)
4.9/5 (35)
The table below shows hypothetical prices for a particular anatomy textbook at a university bookstore over several years. 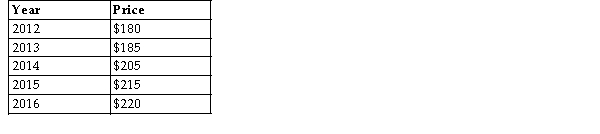 TABLE 2-4
-Refer to Table 2-4. Assume that 2012 is used as the base year, with the index number = 100. The value of the index number in 2014 is
TABLE 2-4
-Refer to Table 2-4. Assume that 2012 is used as the base year, with the index number = 100. The value of the index number in 2014 is
(Multiple Choice)
4.8/5 (38)
The table below shows hypothetical data for the volume of gold and nickel output across several years.  TABLE 2-5
-Refer to Table 2-5. What is the index number for nickel output in Year 2?
TABLE 2-5
-Refer to Table 2-5. What is the index number for nickel output in Year 2?
(Multiple Choice)
4.9/5 (41)
An economic model that contains a highly realistic set of assumptions is
(Multiple Choice)
4.8/5 (36)
For a given year, an index number of average prices across the economy in Canada, the Consumer Price Index) is the ratio of the
(Multiple Choice)
4.9/5 (46)
Suppose an economist tells you that the unemployment rate in Canada last year was 7.8%. This is an example
Of an) statement.
(Multiple Choice)
4.8/5 (37)
When an economist assumes that the owners of firms are motivated only by the desire to maximize profits, the economist most likely believes that
(Multiple Choice)
4.8/5 (31)
The table below shows hypothetical data for volumes of e-books and hardcover books sold over a 3-year period in a particular city.  TABLE 2-3
-Refer to Table 2-3. Between Year 1 and Year 3, what is the percentage change in sales of hardcover books?
TABLE 2-3
-Refer to Table 2-3. Between Year 1 and Year 3, what is the percentage change in sales of hardcover books?
(Multiple Choice)
4.9/5 (41)
Filters
- Essay(0)
- Multiple Choice(0)
- Short Answer(0)
- True False(0)
- Matching(0)