Exam 2: Economic Theories, Data, and Graphs
Exam 1: Economic Issues and Concepts130 Questions
Exam 2: Economic Theories, Data, and Graphs140 Questions
Exam 3: Demand, Supply, and Price161 Questions
Exam 4: Elasticity160 Questions
Exam 5: Price Controls and Market Efficiency125 Questions
Exam 6: Consumer Behaviour140 Questions
Exam 7: Producers in the Short Run144 Questions
Exam 8: Producers in the Long Run141 Questions
Exam 9: Competitive Markets153 Questions
Exam 10: Monopoly, Cartels, and Price Discrimination126 Questions
Exam 11: Imperfect Competition and Strategic Behaviour126 Questions
Exam 12: Economic Efficiency and Public Policy123 Questions
Exam 13: How Factor Markets Work124 Questions
Exam 14: Labour Markets and Income Inequality117 Questions
Exam 16: Market Failures and Government Intervention123 Questions
Exam 17: The Economics of Environmental Protection133 Questions
Exam 18: Taxation and Public Expenditure121 Questions
Exam 19: What Macroeconomics Is All About116 Questions
Exam 20: The Measurement of National Income117 Questions
Exam 21: The Simplest Short-Run Macro Model156 Questions
Exam 22: Adding Government and Trade to the Simple Macro Model132 Questions
Exam 23: Output and Prices in the Short Run142 Questions
Exam 24: From the Short Run to the Long Run: the Adjustment of Factor Prices148 Questions
Exam 25: Long-Run Economic Growth132 Questions
Exam 26: Money and Banking119 Questions
Exam 27: Money, Interest Rates, and Economic Activity135 Questions
Exam 28: Monetary Policy in Canada122 Questions
Exam 29: Inflation and Disinflation123 Questions
Exam 30: Unemployment Fluctuations and the Nairu120 Questions
Exam 31: Government Debt and Deficits129 Questions
Exam 32: The Gains From International Trade127 Questions
Exam 33: Trade Policy126 Questions
Exam 34: Exchange Rates and the Balance of Payments161 Questions
Select questions type
The table below shows hypothetical data for the volume of gold and nickel output across several years. 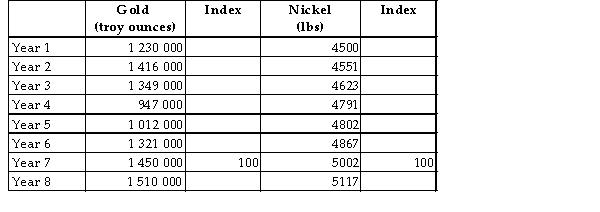 TABLE 2-6
-Refer to Table 2-6. What is the index number for gold output in Year 2?
TABLE 2-6
-Refer to Table 2-6. What is the index number for gold output in Year 2?
(Multiple Choice)
4.9/5  (38)
(38)
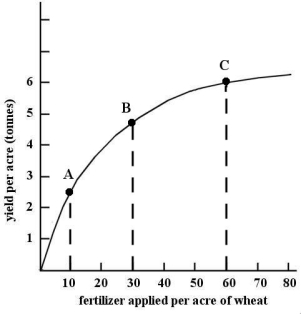 FIGURE 2-4
-Refer to Figure 2-4. The slope of the non-linear function changes as we move along the curve. The slope is
FIGURE 2-4
-Refer to Figure 2-4. The slope of the non-linear function changes as we move along the curve. The slope is
(Multiple Choice)
5.0/5 (39)
Suppose an economist tells you that, on average, people in Canada have too much personal debt. This is an
Example of an)
(Multiple Choice)
4.8/5 (36)
Figure 2-5 shows monthly average per unit) production costs for producing Good X.
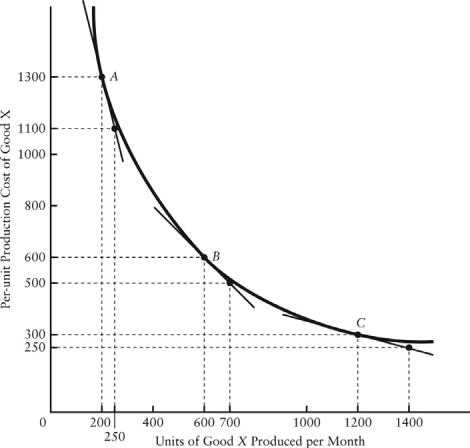 FIGURE 2-5
-Refer to Figure 2-5. What is the slope of this non-linear function when 600 units per month are being produced?
FIGURE 2-5
-Refer to Figure 2-5. What is the slope of this non-linear function when 600 units per month are being produced?
(Multiple Choice)
4.8/5 (39)
In a co-ordinate graph, with Y on the vertical axis and X on the horizontal axis, the variable X is positive and the variable Y is negative in the quadrant.
(Multiple Choice)
5.0/5 (36)
Consider the functional relationship between two variables, X and Y. If Y is an increasing function of X, then
(Multiple Choice)
4.9/5 (43)
Suppose that a particular theory predicts that on Monday, Wednesday, and Friday the stock market will rise and that on Tuesday and Thursday the stock market will fall. If an economist tests this theory and finds that over a six-month period the theory predicts accurately, the economist would likely say that the theory
(Multiple Choice)
4.7/5 (40)
The table below shows hypothetical per-minute cell phone charges for ʺpay-and-talkʺ service over several years.  TABLE 2-2
-Refer to Table 2-2. Assume that 2008 is used as the base year, with the index number = 100. The value of the index number in 2012 is
TABLE 2-2
-Refer to Table 2-2. Assume that 2008 is used as the base year, with the index number = 100. The value of the index number in 2012 is
(Multiple Choice)
4.7/5 (45)
Which is the best description of a normative statement? A normative statement
(Multiple Choice)
4.8/5 (33)
Choose the statement that best characterizes an economic theory. An economic theory
(Multiple Choice)
4.9/5 (34)
Suppose we observe that consumption of electricity decreases when the price of electricity rises. We can say that the two variables are related
(Multiple Choice)
4.8/5 (32)
 FIGURE 2-1
-Suppose there is a linear relationship between the ticket price P) to a university basketball game and the number of tickets sold Q). If the ticket price is $20, then 600 tickets are sold; if the ticket price is $8, then $3000 tickets are sold. What is the slope of the function if Q is plotted on the horizontal axis and P is plotted on the vertical axis?
FIGURE 2-1
-Suppose there is a linear relationship between the ticket price P) to a university basketball game and the number of tickets sold Q). If the ticket price is $20, then 600 tickets are sold; if the ticket price is $8, then $3000 tickets are sold. What is the slope of the function if Q is plotted on the horizontal axis and P is plotted on the vertical axis?
(Multiple Choice)
4.7/5 (42)
The table below shows hypothetical tuition costs at a Canadian university.  TABLE 2-1
-Refer to Table 2-1. The increase in tuition fees from 2012 to 2016 is
TABLE 2-1
-Refer to Table 2-1. The increase in tuition fees from 2012 to 2016 is
(Multiple Choice)
4.8/5 (38)
When using statistics in economics, the possibility of error
(Multiple Choice)
4.7/5 (39)
When an increase in one variable is associated with an increase in a second variable, the two variables are
(Multiple Choice)
4.8/5 (33)
Filters
- Essay(0)
- Multiple Choice(0)
- Short Answer(0)
- True False(0)
- Matching(0)