Exam 12: Part A: Aggregate Demand and Aggregate Supply
Exam 1: Part A: Limits, Alternatives, and Choices60 Questions
Exam 1: Part B: Limits, Alternatives, and Choices265 Questions
Exam 2: Part A: The Market System and the Circular Flow42 Questions
Exam 2: Part B: The Market System and the Circular Flow119 Questions
Exam 3: Part A: Demand, Supply, and Market Equilibrium51 Questions
Exam 3: Part B: Demand, Supply, and Market Equilibrium291 Questions
Exam 4: Part A: Market Failures: Public Goods and Externalities36 Questions
Exam 4: Part B: Market Failures: Public Goods and Externalities133 Questions
Exam 5: Part A: Governments Role and Government Failure1 Questions
Exam 5: Part B: Governments Role and Government Failure121 Questions
Exam 6: Part A: An Introduction to Macroeconomics31 Questions
Exam 6: Part B: An Introduction to Macroeconomics65 Questions
Exam 7: Part A: Measuring the Economys Output30 Questions
Exam 7: Part B: Measuring the Economys Output191 Questions
Exam 8: Part A: Economic Growth35 Questions
Exam 8: Part B: Economic Growth122 Questions
Exam 9: Part A: Business Cycles, Unemployment, and Inflation40 Questions
Exam 9: Part B: Business Cycles, Unemployment, and Inflation193 Questions
Exam 10: Part A: Basic Macroeconomic Relationships26 Questions
Exam 10: Part B: Basic Macroeconomic Relationships200 Questions
Exam 11: Part A: The Aggregate Expenditures Model47 Questions
Exam 11: Part B: The Aggregate Expenditures Model238 Questions
Exam 12: Part A: Aggregate Demand and Aggregate Supply35 Questions
Exam 12: Part B: Aggregate Demand and Aggregate Supply203 Questions
Exam 13: Part A: Fiscal Policy, Deficits, Surpluses, and Debt53 Questions
Exam 13: Part B: Fiscal Policy, Deficits, Surpluses, and Debt234 Questions
Exam 14: Part A: Money, Banking, and Money Creation56 Questions
Exam 14: Part B: Money, Banking, and Money Creation206 Questions
Exam 15: Part A: Interest Rates and Monetary Policy47 Questions
Exam 15: Part B: Interest Rates and Monetary Policy239 Questions
Exam 16: Part A: Long-Run Macroeconomic Adjustments28 Questions
Exam 16: Part B: Long-Run Macroeconomic Adjustments122 Questions
Exam 17: Part A: International Trade40 Questions
Exam 17: Part B: International Trade188 Questions
Exam 17: Part C: Financial Economics323 Questions
Exam 18: Part A: The Balance of Payments and Exchange Rates133 Questions
Exam 18: Part B: The Balance of Payments and Exchange Rates30 Questions
Exam 19: The Economics of Developing Countries254 Questions
Select questions type
Describe the change in short-run aggregate supply that should result from each of the following changes in determinants.Assume that nothing else is changing besides the identified change.(Use "Decrease" or "Increase.")
(a) A rise in the average price of inputs;
(b) An increase in worker productivity;
(c) Government antipollution regulations become stricter;
(d) A new subsidy program is enacted for new business investment in productive equipment;
(e) Energy prices decline.
(Essay)
4.9/5  (38)
(38)
Identify the ways in which each of the following determinants would have to change to cause a decrease in aggregate demand: consumer wealth, consumer expectations, business taxes, national income in countries abroad, exchange rates.
(Essay)
4.9/5 (39)
Would increased downward price flexibility lead to less severe or more severe recessions? Explain.
(Essay)
4.9/5 (39)
Suppose an economic advisor to the Prime Minister recommended a personal income tax increase.Indicate the expected effects on aggregate demand and on short-run aggregate supply.
(Essay)
4.9/5 (50)
What are five reasons for the downward price-level inflexibility, especially as it pertains to wages and prices?
(Essay)
4.7/5 (45)
List the three major determinants that can cause a shift in the short-run aggregate supply.
(Essay)
4.7/5 (29)
List three events that would shift the short-run aggregate supply curve leftward.
(Essay)
4.9/5 (41)
List four government tax or spending policy options that would shift the short-run aggregate supply curve rightward.
(Essay)
4.8/5 (45)
In the table below are aggregate demand and aggregate supply schedules.  (a) Suppose in Year 1, aggregate demand is shown in columns (1) and (2) in the above table and short-run aggregate supply is shown in columns (1) and (4) in the above table.What will be the equilibrium level of real GDP and the equilibrium price level?
(b) Suppose in Year 2, aggregate demand changes and is now shown in columns (1) and (3).What will be the new equilibrium level of real GDP and the new equilibrium price level?
(c) Suppose in Year 3, aggregate demand changes and is now shown again in columns (1) and (2).What will be the new level of real GDP and the new price level if prices and wages are completely flexible downward?
(d) Suppose in Year 3, aggregate demand changes and is now shown again in columns (1) and (2).What will be the new level of real GDP and the new price level if prices and wages are completely inflexible downward?
(a) Suppose in Year 1, aggregate demand is shown in columns (1) and (2) in the above table and short-run aggregate supply is shown in columns (1) and (4) in the above table.What will be the equilibrium level of real GDP and the equilibrium price level?
(b) Suppose in Year 2, aggregate demand changes and is now shown in columns (1) and (3).What will be the new equilibrium level of real GDP and the new equilibrium price level?
(c) Suppose in Year 3, aggregate demand changes and is now shown again in columns (1) and (2).What will be the new level of real GDP and the new price level if prices and wages are completely flexible downward?
(d) Suppose in Year 3, aggregate demand changes and is now shown again in columns (1) and (2).What will be the new level of real GDP and the new price level if prices and wages are completely inflexible downward?
(Essay)
4.7/5 (47)
Some economists argue that it is easier to resolve demand-pull inflation than cost-push inflation.Use the aggregate demand-aggregate supply (short-run) model to explain this assertion.
(Essay)
4.9/5 (35)
Explain the relationship between the aggregate expenditures model in graph (A) below and the aggregate demand model in graph (B) below where aggregate demand is shifting. 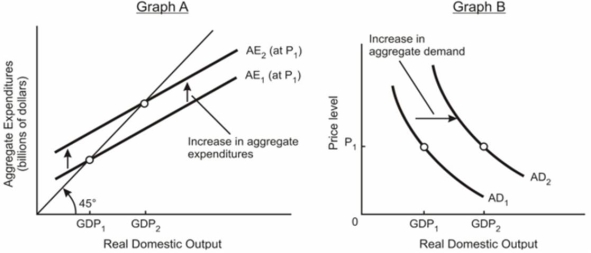
(Essay)
4.8/5 (33)
How can the aggregate demand curve be derived from the aggregate expenditures model?
(Essay)
4.8/5 (38)
Explain the three reasons given for the downward slope of the aggregate demand curve.
(Essay)
4.9/5 (44)
Filters
- Essay(0)
- Multiple Choice(0)
- Short Answer(0)
- True False(0)
- Matching(0)