Exam 12: Part B: Aggregate Demand and Aggregate Supply
Exam 1: Part A: Limits, Alternatives, and Choices60 Questions
Exam 1: Part B: Limits, Alternatives, and Choices265 Questions
Exam 2: Part A: The Market System and the Circular Flow42 Questions
Exam 2: Part B: The Market System and the Circular Flow119 Questions
Exam 3: Part A: Demand, Supply, and Market Equilibrium51 Questions
Exam 3: Part B: Demand, Supply, and Market Equilibrium291 Questions
Exam 4: Part A: Market Failures: Public Goods and Externalities36 Questions
Exam 4: Part B: Market Failures: Public Goods and Externalities133 Questions
Exam 5: Part A: Governments Role and Government Failure1 Questions
Exam 5: Part B: Governments Role and Government Failure121 Questions
Exam 6: Part A: An Introduction to Macroeconomics31 Questions
Exam 6: Part B: An Introduction to Macroeconomics65 Questions
Exam 7: Part A: Measuring the Economys Output30 Questions
Exam 7: Part B: Measuring the Economys Output191 Questions
Exam 8: Part A: Economic Growth35 Questions
Exam 8: Part B: Economic Growth122 Questions
Exam 9: Part A: Business Cycles, Unemployment, and Inflation40 Questions
Exam 9: Part B: Business Cycles, Unemployment, and Inflation193 Questions
Exam 10: Part A: Basic Macroeconomic Relationships26 Questions
Exam 10: Part B: Basic Macroeconomic Relationships200 Questions
Exam 11: Part A: The Aggregate Expenditures Model47 Questions
Exam 11: Part B: The Aggregate Expenditures Model238 Questions
Exam 12: Part A: Aggregate Demand and Aggregate Supply35 Questions
Exam 12: Part B: Aggregate Demand and Aggregate Supply203 Questions
Exam 13: Part A: Fiscal Policy, Deficits, Surpluses, and Debt53 Questions
Exam 13: Part B: Fiscal Policy, Deficits, Surpluses, and Debt234 Questions
Exam 14: Part A: Money, Banking, and Money Creation56 Questions
Exam 14: Part B: Money, Banking, and Money Creation206 Questions
Exam 15: Part A: Interest Rates and Monetary Policy47 Questions
Exam 15: Part B: Interest Rates and Monetary Policy239 Questions
Exam 16: Part A: Long-Run Macroeconomic Adjustments28 Questions
Exam 16: Part B: Long-Run Macroeconomic Adjustments122 Questions
Exam 17: Part A: International Trade40 Questions
Exam 17: Part B: International Trade188 Questions
Exam 17: Part C: Financial Economics323 Questions
Exam 18: Part A: The Balance of Payments and Exchange Rates133 Questions
Exam 18: Part B: The Balance of Payments and Exchange Rates30 Questions
Exam 19: The Economics of Developing Countries254 Questions
Select questions type
Refer to the diagram below. 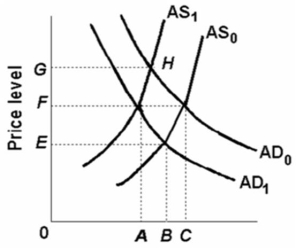 A shift of the aggregate demand curve from AD1 to AD0 might be caused by a(n):
Free
(Multiple Choice)
4.8/5  (32)
(32)
Correct Answer: Verified
C
Suppose that real domestic output in an economy is 20 units, the quantity of inputs is 10, and the price of each input is $4.Refer to the above information.Given an increase in input price from $4 to $6, we would expect the aggregate:
Free
(Multiple Choice)
4.9/5 (30)
Correct Answer:Verified
A
We would expect a decline in personal and corporate income taxes to:
Free
(Multiple Choice)
4.8/5 (42)
Correct Answer:Verified
D
Aggregate demand decreases and real output falls but the price level remains the same.Which factor most likely contributes to downward price inflexibility?
(Multiple Choice)
4.8/5 (38)
Refer to the information below.Investment spending would most likely be influenced by changes in: The following list of factors, are related to the aggregate demand curve.Real-balances effect
Household expectations
Interest-rate effect
Personal income tax rates
Profit expectations
National income abroad
Government spending
Foreign trade effect
Exchange rates
Degree of excess capacity
(Multiple Choice)
4.9/5 (32)
Which effect best explains the downward slope of the aggregate demand curve?
(Multiple Choice)
4.8/5 (35)
The aggregate expenditures model and the aggregate demand curve can be reconciled because, other things equal, in the aggregate expenditures model:
(Multiple Choice)
4.9/5 (43)
Which of the following statements correctly states the relationship between the per-unit production cost of output and productivity?
(Multiple Choice)
4.9/5 (36)
The recession that began in 2008 dispelled the idea of The Great Moderation.
(True/False)
4.9/5 (41)
An increase in wealth from a substantial increase in stock prices will move the economy along the existing aggregate demand curve.
(True/False)
4.9/5 (35)
A n expected rise in the rate of inflation for consumer goods will:
(Multiple Choice)
4.8/5 (46)
Suppose the full-employment level of real output (Q) for a hypothetical economy is $500 and that the price level (P) initially is 100.Use the following short-run aggregate supply schedules to answer the next question.  Refer to the information above.If the price level unexpectedly increases from 100 to 125, the level of real output in the short run will:
(Multiple Choice)
4.9/5 (35)
Suppose higher taxes on businesses cause a decrease in spending on plant and equipment.How will this affect the aggregate expenditure (AE) and the aggregate demand (AD) schedules?
(Multiple Choice)
4.8/5 (41)
Refer to the diagram given below. 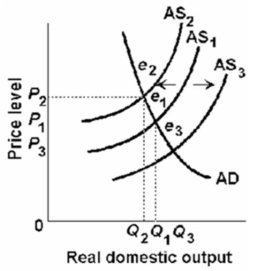 Cost-push inflation can be illustrated by a:
(Multiple Choice)
4.8/5 (36)
Refer to the diagram given below. 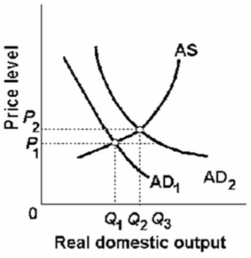 If AD1 shifts to AD2, then the equilibrium output and price level are:
(Multiple Choice)
4.9/5 (34)
Refer to the diagram below.Suppose that aggregate demand increased from AD1 to AD2.For the price level to stay constant: 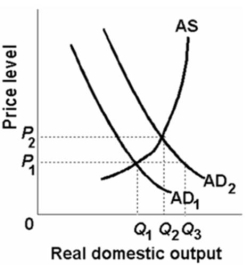
(Multiple Choice)
4.8/5 (29)
Refer to the diagram given below. 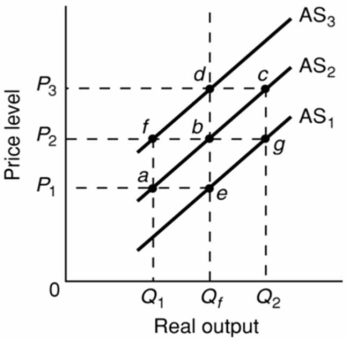 Assume that the nominal wages of workers are initially set on the basis of the price level P2 and that the economy is initially operating at its full-employment level of output Qf.In the long run, demand-pull inflation could best be shown as:
(Multiple Choice)
4.8/5 (34)
Filters
- Essay(0)
- Multiple Choice(0)
- Short Answer(0)
- True False(0)
- Matching(0)